
Data Analytics Syllabus in Hyderabad
A Data Analytics syllabus in Hyderabad typically covers Excel, SQL, Python, Statistics, Power BI, and Tableau, along with data cleaning, visualization, and Business Intelligence. Modern programs also introduce Machine Learning basics and Generative AI. Learners work on real-time projects like sales dashboards and churn analysis, building a portfolio for Data Analyst roles.
Table of Contents
Data Analytics Syllabus in Hyderabad: A Complete Guide to Modules, Tools, and Career Paths
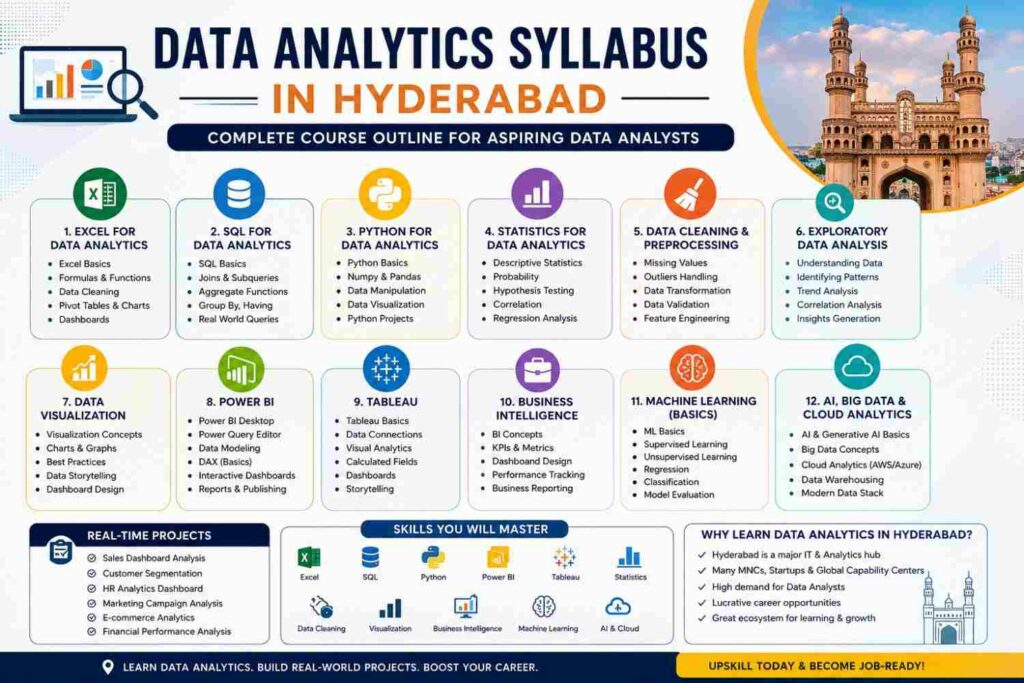
If you have been researching a Data Analytics Course in Hyderabad, you have probably noticed that every institute lists a slightly different curriculum. That makes the actual Data Analytics Syllabus in Hyderabad one of the most important things to check before enrolling — because the syllabus is what decides whether you walk out job-ready or simply “course-completed.”
In short: a well-structured Data Analytics syllabus in Hyderabad generally moves through Excel, Statistics, SQL, Python, Data Visualization tools like Power BI and Tableau, Business Intelligence concepts, and an introduction to Machine Learning and Generative AI — all tied together with real-time projects and interview preparation. The exact depth and sequencing can vary by institute, but this is the general shape a practical, job-oriented program takes.
A Data Analyst is the professional who does this — collecting data, cleaning it, analyzing it, and presenting findings in a way that non-technical stakeholders can act on. Before you commit money and months of your time to any program, understanding what a Data Analytics syllabus actually means, and what it should contain, protects you from two common mistakes: choosing a course that is too theoretical, or choosing one that skips fundamentals in favor of flashy tools.
Hyderabad has become one of the more active hubs for analytics-related hiring in India, driven by IT services firms, banking and financial services companies, healthcare and pharma organizations, e-commerce players, and a growing number of Global Capability Centers (GCCs) that run data operations for global parent companies. As these organizations lean more heavily on data-driven decision-making, they need analysts who can turn raw numbers into business insight — not just people who have watched tutorials.
This is why learners should expect a modern Data Analytics syllabus to include not just tool training, but also structured statistics, database querying, dashboarding, business communication, and — increasingly — an introduction to how AI tools fit into an analyst’s daily workflow. Syllabus depth can vary depending on the institute, the course duration, whether the program is beginner-focused or advanced, and whether it includes a specialization such as Business Intelligence or Marketing Analytics. Because of this variation, students should always ask for a detailed, module-wise syllabus before joining, and should specifically look for practical, industry-oriented training rather than a purely lecture-based format. Skills, real-world projects, recognized tools, and relevant certifications all combine to support long-term career growth far more than certificates alone.
What is Data Analytics?
Data Analytics is the practice of inspecting, cleaning, transforming, and modeling data to discover useful information and support decision-making. In simple terms, it is how businesses convert raw numbers — sales records, website clicks, customer feedback, transaction logs — into insights they can act on.
Businesses use data analytics to answer questions like: Which products are selling best this quarter? Analysts approach these questions using four broad categories:
- Descriptive Analytics — summarizes what has already happened (for example, monthly sales reports or website traffic summaries).
- Diagnostic Analytics — investigates why something happened (for example, why did revenue dip in a particular region).
- Predictive Analytics — uses historical data and statistical models to estimate what might happen next (for example, forecasting next quarter’s demand).
- Prescriptive Analytics — recommends specific actions based on the analysis (for example, suggesting optimal inventory levels).
A real-world example: an e-commerce company might use descriptive analytics to see that cart abandonment is at 68%, diagnostic analytics to find that abandonment spikes at the shipping-cost step, predictive analytics to estimate how a discount would affect conversion, and prescriptive analytics to recommend a specific free-shipping threshold. This is exactly why data-driven decision-making has become a core business function rather than a niche technical activity — decisions backed by data tend to be more consistent and defensible than decisions based purely on intuition.
What is a Data Analytics Syllabus?
A Data Analytics syllabus is the structured outline of everything a learner is expected to study during a course — the concepts, tools, techniques, and projects arranged in a logical sequence. A well-designed syllabus typically moves from foundational concepts to applied, tool-based skills, and finally into real-world projects and interview preparation.
Most syllabi are built around these broad areas:
- Core concepts of data, variables, and the analytics lifecycle
- Data analysis techniques, including data cleaning and exploratory analysis
- Data visualization principles and dashboarding tools
- Statistical concepts used to interpret data correctly
- Database management and querying (usually SQL)
- Programming for analytics (usually Python)
- Business Intelligence tools and reporting workflows
- Machine Learning basics, kept at a level relevant to analysts rather than data scientists
- AI and Generative AI as they apply to analytics workflows
- Real-time projects and case studies that simulate actual business problems
- Interview preparation, including SQL and case-study rounds
It is worth repeating that the exact syllabus can differ meaningfully between institutes. Duration, the learner’s starting level (complete beginner vs. someone with a technical background), and whether the course targets a specialization (like BI reporting or marketing analytics) will all shape what is included and how deep each topic goes. This is precisely why comparing a Data Analytics Course Syllabus across two or three institutes, module by module, is one of the smartest things a prospective learner can do.
Data Analytics Syllabus in Hyderabad
Here is a detailed, module-wise breakdown of what an industry-oriented Data Analytics Curriculum commonly includes.
Module 1: Introduction to Data Analytics
Covers what Data Analytics is, the four types of analytics (descriptive, diagnostic, predictive, prescriptive), the data analytics lifecycle (collect → clean → analyze → visualize → communicate), the day-to-day role of a Data Analyst, and how data-driven decision-making plays out in real business use cases across industries.
Module 2: Excel for Data Analytics
Despite newer tools, Excel remains a staple because it is fast, widely available, and ideal for smaller datasets and quick analysis. This module covers Excel fundamentals, data formatting, sorting and filtering, data validation, and conditional formatting. It moves into formulas and functions such as IF, SUMIF, COUNTIF, VLOOKUP, XLOOKUP, and INDEX-MATCH, and then into Pivot Tables, Pivot Charts, and dashboard-building. Data cleaning in Excel and practical business exercises round out the module. Excel stays relevant because many businesses still exchange data in spreadsheet format, and quick ad-hoc analysis is often faster in Excel than in code.
Module 3: Statistics for Data Analytics
Statistics is what allows an analyst to interpret data correctly rather than just describe it. This module covers mean, median, mode, range, variance, and standard deviation, followed by probability, percentiles, correlation, and regression. Hypothesis testing and sampling methods are introduced, along with the distinction between descriptive statistics (summarizing data) and inferential statistics (drawing conclusions about a population from a sample). Without this foundation, tool-based skills tend to produce charts without real insight.
Module 4: SQL for Data Analytics
SQL is arguably one of the most important skills for Data Analyst Jobs in India, since almost every business stores data in relational databases. This module covers database fundamentals, tables, rows, and columns, and then SELECT, WHERE, ORDER BY, GROUP BY, and HAVING clauses. Aggregate functions and DISTINCT are followed by joins (INNER, LEFT, RIGHT), subqueries, Common Table Expressions (CTEs), CASE statements, and window functions. The module also covers SQL-based data cleaning, common SQL interview queries, and real-world SQL projects. Recruiters consistently test SQL in interviews because it directly reflects whether a candidate can independently pull and shape data.
Module 5: Python for Data Analytics
Python fundamentals — variables, data types, conditional statements, loops, functions, lists, dictionaries, and tuples — form the base. From there, the module moves into NumPy and Pandas for data manipulation, working with DataFrames, data cleaning and transformation, and Exploratory Data Analysis (EDA). Visualization libraries like Matplotlib and Seaborn are introduced, backed by practical projects. It’s worth clarifying: Python for Data Analytics focuses on data manipulation, analysis, and visualization — it is narrower in scope than the software engineering skills (system design, application architecture) covered in a full development track.
Module 6: Data Cleaning and Preprocessing
Analysts often say that a large share of their actual working time goes into cleaning data, not analyzing it. This module covers handling missing values, duplicate records, incorrect data types, outliers, and inconsistent formats, along with data transformation, normalization, validation, and handling categorical data — all in service of preparing a dataset that is actually reliable to analyze.
Module 7: Exploratory Data Analysis (EDA)
EDA is about understanding a dataset before drawing conclusions from it — identifying patterns, spotting trends, detecting anomalies, and running correlation analysis and summary statistics. This module ties statistical concepts and Python together, teaching learners to visually explore data and frame the right business questions before jumping to modeling or dashboarding.
Module 8: Data Visualization
This module explains why visualization matters: humans process visual patterns far faster than raw tables. It covers bar charts, line charts, pie charts, scatter plots, histograms, and heatmaps, along with KPI dashboards and the principles of storytelling with data — including how to choose the right chart type for a given question. Effective visualization is often what actually drives a business decision, since stakeholders act on what they can quickly understand.
Module 9: Power BI
Power BI training typically starts with the Power BI Desktop interface and data import, then covers Power Query for data cleaning and transformation, data modeling and relationships, and DAX fundamentals for measures and calculated columns. Learners build KPIs, interactive dashboards, and reports using filters and slicers, and are introduced to the Power BI Service for publishing dashboards. Real-world Power BI projects anchor the module.
Module 10: Tableau
Tableau modules typically begin with connecting to data sources and understanding dimensions and measures, then move into building worksheets, charts, and filters, followed by calculated fields and dashboard design. Interactive visualizations and Tableau’s storytelling features are covered, along with practical business dashboard projects.
Module 11: Business Intelligence
This module frames BI as the broader discipline that Power BI and Tableau serve — covering BI reporting, dashboards, KPIs, and business metrics as tools for decision support. Real-world BI use cases show how reporting pipelines are actually used inside organizations, from daily sales trackers to executive-level scorecards.
Module 12: Machine Learning Basics
For Data Analysts, Machine Learning is generally covered at an introductory level — enough to understand supervised learning (classification, regression) and unsupervised learning (clustering), along with basic model evaluation and how predictive analytics fits into a broader analytics workflow. It’s important to note the difference between Data Analytics and Data Science here: this module builds awareness and light hands-on exposure, not the deep statistical modeling and algorithm-building that a Data Science syllabus would cover.
Module 13: Artificial Intelligence and Generative AI
Modern analytics training increasingly introduces how AI and Generative AI tools fit into an analyst’s workflow — AI-assisted data analysis, natural language queries against datasets, AI-generated insights, prompting techniques for analytics tasks, automated reporting, and AI-assisted visualization. This module should make one thing clear: AI tools are meant to complement analytical fundamentals such as SQL, statistics, and data interpretation — not replace the judgment an analyst brings to a business problem.
Module 14: Big Data and Cloud Analytics
This module introduces Big Data concepts, cloud analytics, data warehouses, and cloud databases, along with basic exposure to platforms like AWS, Azure, or Google Cloud. The goal at the Data Analyst level is conceptual familiarity with modern analytics environments, not deep cloud engineering.
Module 15: Real-Time Projects and Case Studies
Practical learning is what separates a job-ready analyst from someone who has only completed video lectures. Typical project themes include a Sales Analytics Dashboard, E-commerce Customer Analysis, HR Analytics, Marketing Campaign Analysis, Financial Data Analysis, Customer Churn Analysis, Retail Analytics, Healthcare Analytics, and Inventory Analytics. These projects help learners build a portfolio they can walk through confidently in interviews, demonstrating not just tool knowledge but the ability to frame a business problem and communicate findings.
Data Analytics Syllabus by Skill
Skill | Topics Covered | Common Tools | Career Relevance |
Excel | Formulas, Pivot Tables, dashboards, data cleaning | Microsoft Excel | Entry-level reporting, ad-hoc analysis |
SQL | Joins, subqueries, CTEs, window functions | MySQL, PostgreSQL, SQL Server | Core skill tested in almost every analyst interview |
Python | Pandas, NumPy, EDA, visualization | Python, Jupyter Notebook | Automating analysis, handling larger datasets |
Statistics | Descriptive & inferential statistics, regression | Excel, Python, R | Interpreting data correctly, avoiding false conclusions |
Power BI | Data modeling, DAX, dashboards | Power BI Desktop & Service | High demand for BI Analyst and reporting roles |
Tableau | Calculated fields, storytelling dashboards | Tableau Desktop/Public | Preferred in product and consulting environments |
Data Visualization | Chart selection, KPI design | Excel, Power BI, Tableau, Matplotlib | Communicating insights to non-technical teams |
Business Intelligence | Reporting pipelines, KPIs | Power BI, Tableau, SQL | BI Analyst, Reporting Analyst roles |
Machine Learning | Supervised/unsupervised basics | Python (Scikit-learn) | Awareness for analyst-to-data-scientist transitions |
Generative AI | AI-assisted analysis, prompting | ChatGPT, Copilot, AI plugins | Faster reporting, augmented analysis |
Data Analytics Course Syllabus: Beginner to Advanced
Level | Topics | Expected Outcome |
Beginner | Excel, basic statistics, data concepts | Understand data fundamentals |
Intermediate | SQL, Python, Power BI, Tableau | Analyze and visualize real datasets |
Advanced | Advanced SQL, Python, BI, predictive analytics | Solve complex business problems |
Industry-Ready | Projects, case studies, dashboards, interview preparation | Build a job-ready portfolio |
Data Analytics Tools Covered in the Syllabus
Essential tools that almost every Data Analytics syllabus should cover: Microsoft Excel, SQL, Python, Power BI, and Tableau. These five form the backbone of most analyst job descriptions.
Additional/advanced tools that may appear depending on the institute and specialization: R (for statistical modeling in some programs), Pandas, NumPy, Matplotlib, and Seaborn (Python libraries used within the Python module), MySQL or PostgreSQL as the specific database engine used for SQL practice, cloud analytics platforms such as AWS, Azure, or Google Cloud for exposure to modern data environments, and Generative AI tools for AI-assisted analysis and reporting.
Data Analytics Syllabus in Hyderabad: Course Duration
Course duration varies significantly depending on the institute, the depth of the curriculum, class frequency, and how much project work is included. As a general industry/course-format estimate — not a fixed rule — programs tend to fall into these bands:
Learning Format | Typical Duration |
Basic Foundation | 4–8 weeks |
Job-Oriented Course | 2–4 months |
Advanced Program | 4–6+ months |
Actual duration depends entirely on the specific institute, curriculum depth, weekly class schedule, and how much time is allocated to hands-on projects versus lectures.
Who Can Learn Data Analytics?
Data Analytics is fairly accessible across academic backgrounds. B.Tech, B.Sc, B.Com, and BBA graduates, MBA students, engineering graduates from any branch, non-IT graduates, working professionals looking to upskill, career switchers, and fresh graduates can all realistically learn Data Analytics. What matters more than the specific degree is logical thinking, a genuine willingness to learn tools like Excel and SQL, and consistent hands-on practice. No specific degree by itself guarantees employment — outcomes depend on the skills built and demonstrated through practice and projects.
Prerequisites for Learning Data Analytics
- Basic computer knowledge
- Basic mathematics (arithmetic, percentages, basic algebra)
- Logical and analytical thinking
- Genuine interest in working with numbers and data
- Willingness to learn Excel and SQL from scratch
- Basic English communication for reporting and interview rounds
- No advanced programming background is required to start at the beginner level
Data Analytics Career Opportunities
Common roles that Data Analytics skills open up include Data Analyst, Junior Data Analyst, Business Intelligence Analyst, Reporting Analyst, Marketing Analyst, Financial Analyst, Operations Analyst, Product Analyst, Data Visualization Analyst, Business Analyst, and, with experience, Senior Data Analyst. The specific role and title someone moves into typically depends on which skills they specialize in (SQL-heavy vs. BI-heavy vs. business-facing) and which industry they enter.
Data Analyst Career Path
Career Stage | Skills to Learn | Tools/Technologies | Typical Job Roles |
Beginner | Excel, basic statistics, data concepts | Excel, Google Sheets | Data Entry Analyst, Reporting Trainee |
Intermediate | SQL, Python, Power BI, Tableau | SQL, Power BI, Tableau, Python | Junior Data Analyst, BI Analyst |
Advanced | Advanced SQL, statistics, predictive analytics | Python, advanced SQL, BI platforms | Data Analyst, Senior Data Analyst |
Expert | Business strategy, ML awareness, stakeholder management | Cloud analytics, BI suites, ML basics | Lead Analyst, Analytics Manager |
Progression from entry-level to senior or lead roles generally comes from a mix of deepening technical skills, taking ownership of larger business problems, and developing the communication skills to influence decisions — not from tool knowledge alone.
Data Analytics Skills Employers Look For
Technical skills: Excel, SQL, Python, Statistics, Data Cleaning, Data Visualization, Power BI, Tableau, Business Intelligence.
Business/soft skills: Data Interpretation, Problem Solving, Communication, Business Understanding, Critical Thinking, and Presentation Skills.
The distinction matters because technical skills get a candidate shortlisted, but business and soft skills are usually what determine performance once hired — an analyst who can explain “why the number moved” in plain language to a non-technical manager is far more valuable than one who can only produce charts.
Data Analytics Syllabus vs Data Science Syllabus
Factor | Data Analytics | Data Science |
Primary Focus | Interpreting existing data for business decisions | Building predictive models and algorithms |
Programming | Basic to intermediate Python/SQL | Advanced Python, sometimes R and Java |
Statistics | Applied, decision-focused | Deep statistical and mathematical modeling |
Machine Learning | Introductory awareness | Core, in-depth focus |
Tools | Excel, SQL, Power BI, Tableau | Python/R, ML frameworks, cloud ML platforms |
Typical Projects | Dashboards, reporting, churn/sales analysis | Predictive models, recommendation systems |
Career Roles | Data Analyst, BI Analyst, Reporting Analyst | Data Scientist, ML Engineer |
Suitable Candidates | Beginners, business-oriented learners | Learners comfortable with heavier math/coding |
The two fields overlap — both start from data — but Data Analytics focuses on explaining what happened and why, while Data Science pushes further into building models that predict or automate decisions.
Data Analytics vs Business Analytics vs Business Intelligence
Factor | Data Analytics | Business Analytics | Business Intelligence |
Main Purpose | Extract insights from data | Apply insights to business strategy | Report and monitor business performance |
Responsibilities | Clean, analyze, visualize data | Translate data insights into decisions | Build dashboards and recurring reports |
Skills | SQL, Python, statistics | Business acumen, data interpretation | Reporting, KPI tracking, dashboarding |
Tools | Excel, SQL, Python, Power BI, Tableau | Excel, BI tools, some SQL | Power BI, Tableau, SQL |
Coding Requirement | Moderate | Low to moderate | Low |
Typical Job Roles | Data Analyst | Business Analyst | BI Analyst, BI Developer |
Career Opportunities | Analytics, reporting roles | Strategy, consulting-adjacent roles | Reporting and dashboard-focused roles |
Why Data Analytics is in Demand in Hyderabad
Hyderabad’s economy includes a strong mix of IT services companies, product-based software firms, startups, banking and financial services, healthcare and pharmaceutical companies, e-commerce and retail businesses, consulting firms, marketing agencies, and a growing number of Global Capability Centers (GCCs) set up by multinational organizations. Across all of these sectors, organizations increasingly rely on analytics for customer insights, sales forecasting, marketing performance measurement, financial planning, operations optimization, product decisions, and overall business performance tracking.
This demand isn’t isolated to Hyderabad — it reflects a broader national trend. Industry analysis referencing NASSCOM data has pointed to a shortfall of over 200,000 data analytics professionals in India, a gap reported to have persisted through 2026, meaning demand for trained analysts continues to outpace the available skilled talent pool. Separately, LinkedIn’s “Jobs on the Rise” report has listed Data Analyst roles among the fastest-growing job categories in India. These figures should be read as general market indicators from third-party sources rather than guarantees for any individual learner.
Data Analytics Jobs in Hyderabad
Common job titles that appear in the Hyderabad market include Data Analyst, Junior Data Analyst, Business Intelligence Analyst, Reporting Analyst, MIS Analyst, Marketing Data Analyst, Financial Data Analyst, Operations Analyst, Power BI Data Analyst, and SQL Data Analyst. For entry-level candidates, employers commonly look for solid SQL and Excel fundamentals, comfort with at least one visualization tool (Power BI or Tableau), basic statistical understanding, and — increasingly — one or two well-explained portfolio projects that show how the candidate approaches a real business question.
Salary Expectations After Learning Data Analytics
Salary outcomes for Data Analysts vary widely based on experience, specific skill set, company size and industry, location, job title, educational background, certifications held, interview performance, and the strength of a candidate’s project portfolio. Third-party sources such as Glassdoor, LinkedIn Salary Insights, and Naukri publish aggregated salary ranges for Data Analyst roles in India, but these figures are industry estimates aggregated from self-reported and job-board data, not fixed or guaranteed outcomes. No course or training program can ethically promise a specific salary, and any program that does should be treated with caution.
Certifications That Can Support a Data Analytics Career
- Microsoft Power BI Data Analyst Associate (PL-300) — Microsoft’s official certification validating Power BI data preparation, modeling, and visualization skills (Microsoft Learn)
- Google Data Analytics Professional Certificate — an entry-level, project-based certificate covering the analytics process end-to-end (Google Career Certificates)
- Tableau Certifications — including the Tableau Desktop Specialist and Certified Data Analyst credentials (Tableau Certification)
- SQL-related certifications offered by various platforms and database vendors
- Cloud analytics certifications from AWS, Microsoft Azure, or Google Cloud for learners wanting exposure to cloud-based data environments
Certifications can demonstrate structured learning and initiative to a recruiter, but they do not replace practical skills, real project experience, or genuine interview preparation. Employers generally weigh demonstrated ability — through projects and interview performance — more heavily than a certificate alone.
How to Choose the Best Data Analytics Course in Hyderabad
Before enrolling, evaluate a course against this checklist:
- Is there a detailed, module-wise syllabus available upfront?
- What is the trainer’s actual industry experience?
- How many hands-on projects are included, and are they based on real business scenarios?
- Does the course include dedicated SQL training, not just a brief overview?
- Is Excel covered in enough depth for dashboarding and business use cases?
- Is Python taught with practical data analysis projects, not just syntax?
- Are Power BI and Tableau both covered, or only one?
- Are real-world case studies used to teach concepts?
- Does the program help build a portfolio learners can show in interviews?
- Is there structured interview preparation, including SQL and case rounds?
- Is career guidance offered alongside technical training?
- What is the class format — live, recorded, or hybrid — and does it fit your schedule?
- What is the total course duration, and does it match the depth promised?
- What do genuine reviews and the institute’s reputation suggest?
- What kind of ongoing learning support is available after class hours?
- Is a certification provided, and is placement assistance offered (without unrealistic guarantees)?
Avoid institutes that make unverifiable claims about guaranteed jobs, guaranteed salaries, or placement percentages that cannot be independently confirmed.
Why Learn Data Analytics with Data Analytics Masters
Learners exploring a Data Analytics Course in Hyderabad can consider Data Analytics Masters, a program built around industry-oriented training and hands-on learning. The program focuses on practical coverage of Excel, SQL, Python, Power BI, and Tableau, supported by real-time projects and business use cases rather than purely theoretical lectures. Data Analytics Masters emphasizes experienced trainers, structured interview preparation, and career guidance to help learners translate classroom learning into an interview-ready skill set. As with any training program, outcomes depend on individual effort, consistency, and how actively a learner engages with projects and practice — Data Analytics Masters does not guarantee jobs, salaries, or placement outcomes, but it can help learners build the structured foundation and portfolio needed to compete for Data Analyst Jobs in India.
How to Start Learning Data Analytics in Hyderabad
- Understand Data Analytics fundamentals and the analytics lifecycle
- Learn Excel — formulas, Pivot Tables, and dashboards
- Learn basic statistics — mean, variance, correlation, regression
- Learn SQL — joins, subqueries, window functions
- Learn Python — Pandas, NumPy, and EDA
- Learn Power BI — data modeling and DAX
- Learn Tableau — dashboards and storytelling
- Practice data cleaning on messy, real-world-style datasets
- Build real-world projects (sales dashboards, churn analysis, HR analytics)
- Create a portfolio you can walk through confidently
- Prepare for interviews — SQL rounds, case studies, and dashboard walkthroughs
- Apply for entry-level Data Analyst Jobs in India
Common Mistakes Beginners Make
- Trying to learn too many tools at once instead of going deep on fundamentals
- Ignoring SQL because it feels less “visual” than Power BI or Tableau
- Skipping statistics and jumping straight to tools
- Watching tutorials passively without practicing on real datasets
- Not building original projects
- Copying projects from YouTube without understanding the underlying logic
- Ignoring business context and framing analysis purely as a technical exercise
- Not learning how to explain insights clearly to non-technical audiences
- Depending completely on AI tools instead of understanding the underlying analysis
- Not preparing specifically for SQL and case-study interview rounds
Future Trends in Data Analytics
The field continues to evolve with AI-powered analytics, Generative AI for automated insight generation, automated and self-service dashboards, Augmented Analytics, and more mature Predictive Analytics. Real-time analytics, Cloud Analytics, and Big Data platforms are becoming more mainstream even at the analyst level, alongside natural language analytics (asking questions of data in plain English) and AI-assisted SQL query generation. Data governance and Responsible AI practices are also gaining attention as organizations scale their AI-assisted analytics workflows. The World Economic Forum’s Future of Jobs Report has named data and AI roles among the top drivers of job creation globally over the coming years, which suggests these trends will likely continue shaping the Data Analytics Career Path — though, as with any forecast, specific outcomes for individual learners cannot be guaranteed.
Statistics, Trends & Market Demand
A few credible, sourced data points worth knowing:
- NASSCOM has projected a shortfall of more than 200,000 data analytics professionals in India, a gap reported to persist into 2026, according to industry analysis.
- LinkedIn’s Jobs on the Rise report lists Data Analyst roles among the fastest-growing job categories in India, based on LinkedIn’s platform data.
- The World Economic Forum’s Future of Jobs report identifies data and AI roles as top drivers of global job creation in the coming years.
These are third-party industry estimates current as of their publication dates, not fixed guarantees, and figures can change as new reports are released. Readers should treat any salary or hiring figure as directional rather than exact.
Key Takeaways
- A Data Analytics syllabus in Hyderabad generally spans Excel, Statistics, SQL, Python, Data Visualization, and Business Intelligence, with growing exposure to Machine Learning basics and Generative AI.
- Excel, SQL, Python, Power BI, and Tableau are the essential tools, while cloud analytics and advanced ML remain optional or introductory add-ons at the analyst level.
- Real-time projects — sales dashboards, churn analysis, HR and marketing analytics — matter as much as tool knowledge, since they build the portfolio recruiters actually ask about.
- Career opportunities range from Junior Data Analyst and BI Analyst roles to Senior Data Analyst and Analytics Manager positions, depending on skill depth and experience.
- Choosing the right course means comparing detailed syllabi, trainer experience, project depth, and interview preparation — not just price or duration.
Frequently Asked Questions
- What is the Data Analytics syllabus in Hyderabad? It typically covers Excel, Statistics, SQL, Python, Data Visualization, Power BI, Tableau, Business Intelligence, an introduction to Machine Learning, and real-time projects, though exact depth varies by institute.
- What topics are included in a Data Analytics course? Core topics include data cleaning, exploratory data analysis, statistical concepts, database querying, programming for analytics, dashboarding, and business communication skills.
- Is SQL included in the Data Analytics syllabus? Yes. SQL is considered a core skill in almost every Data Analytics syllabus, covering joins, subqueries, CTEs, and window functions, since most business data lives in relational databases.
- Does a Data Analytics course include Python? Most job-oriented programs include Python, focusing on Pandas, NumPy, and exploratory data analysis rather than full software development.
- Is Power BI included in Data Analytics training? Yes. Power BI is one of the most commonly taught visualization and BI tools, alongside Tableau, in most modern Data Analytics syllabi.
- Can freshers learn Data Analytics? Yes. Freshers from technical and non-technical backgrounds can learn Data Analytics, provided they are willing to practice consistently and build foundational skills in Excel, SQL, and statistics.
- What are the prerequisites for a Data Analytics course? Basic computer literacy, basic mathematics, logical thinking, and a willingness to learn Excel and SQL are generally sufficient; advanced programming knowledge is not required at the beginner level.
- How long does it take to learn Data Analytics? Duration varies by course format — basic foundation programs may run 4–8 weeks, job-oriented courses 2–4 months, and advanced programs 4–6+ months, depending on the institute and depth.
- What jobs can I get after learning Data Analytics? Common entry points include Junior Data Analyst, Business Intelligence Analyst, Reporting Analyst, Marketing Analyst, and Operations Analyst roles, with progression toward Senior Data Analyst over time.
- Which is the best Data Analytics course in Hyderabad? The best course is the one with a transparent, module-wise syllabus, experienced trainers, real-world projects, and strong interview preparation — comparing a few options against this checklist, including programs like Data Analytics Masters, is the most reliable approach.
Conclusion
A strong Data Analytics syllabus in Hyderabad brings together Excel, SQL, Python, Power BI, Tableau, and Statistics as its technical core, layered with Business Intelligence, an introduction to Machine Learning, and increasingly, Generative AI as a productivity aid rather than a replacement for analytical thinking. What ultimately separates a job-ready analyst from someone who has simply finished a course is practical exposure — real projects like sales dashboards, churn analysis, and marketing performance studies that force learners to frame business questions and communicate answers clearly.
Hyderabad’s expanding mix of IT services firms, BFSI companies, healthcare organizations, e-commerce players, and Global Capability Centers means the underlying demand for trained analysts is real and structural, even though individual outcomes always depend on the skills, projects, and consistency a learner brings to the table. Choosing industry-oriented training — one that is transparent about its syllabus, uses real case studies, and invests in interview preparation — matters far more than chasing the flashiest tool list.
If you’re ready to start, begin with the fundamentals: Excel, statistics, and SQL, then build toward Python, Power BI, and Tableau through hands-on projects. Programs like Data Analytics Masters are built around this exact philosophy — practical, project-driven training in the core tools recruiters look for, supported by interview preparation and career guidance. Explore the Data Analytics Masters course syllabus to see how a structured, industry-oriented curriculum can support the start of your Data Analytics journey.

 in Hyderabad by Brolly.Group