
Skills Required for Data Analyst
Essential Skills Required for Data Analytics-All Levels
1. Technical Skills:
- Excel: Essential for data manipulation, cleaning, and basic analysis. Many users still search for ways to perform advanced functions (e.g., VLOOKUP, pivot tables).
- SQL (Structured Query Language): Crucial for querying databases. Common searches include learning how to filter, join, and aggregate data.
- Programming Languages (Python/R): Python is widely used for data analysis due to its libraries (like Pandas, NumPy). R is also frequently searched for statistical analysis.
- Data Visualization Tools (Tableau, Power BI): Users often search for how to create reports, dashboards, and perform interactive visualizations.
- Data Cleaning & Preparation: Understanding how to handle missing data, outliers, and dataset errors is a frequent concern.
2. Statistical Knowledge:
- Descriptive Statistics: Mean, median, mode, standard deviation, etc., are foundational concepts.
- Inferential Statistics: Hypothesis testing, confidence intervals, and statistical significance.
- Regression Analysis: Linear and logistic regression are common skills in demand for predictive analytics.
3. Soft Skills:
- Critical Thinking: The ability to assess data from different angles and find the most relevant insights.
- Communication Skills: Translating complex data findings into clear, actionable insights is highly sought after.
- Attention to Detail: Ensuring data accuracy and precision is key, and it often comes up in job descriptions and user searches.
4. Tools & Software:
- Google Analytics: For web data analysis and user behavior tracking.
- Microsoft Power BI: A strong alternative to Tableau, with searches often involving integration with Excel and databases.
- Big Data Tools (Hadoop, Spark): While less common for beginners, users interested in handling large datasets may search for these tools.
- Cloud Data Platforms (AWS, Azure): As data storage and analysis shift to the cloud, skills in platforms like AWS and Azure are becoming increasingly important.
5. Data Modeling & Machine Learning (Basic):
- Predictive Modeling: Building simple predictive models using historical data is growing in demand.
- Machine Learning Algorithms: Searches typically focus on getting started with machine learning and understanding basic algorithms like decision trees and clustering.
6. Business Acumen:
- Domain Knowledge: Understanding the industry you are working in (finance, marketing, healthcare) is critical. Search queries often include “how to apply data analysis in X industry.”
- Data-Driven Decision Making: Companies are looking for analysts who can align data insights with business goals, and searches frequently include how to generate reports that drive decisions.
7. Project Management & Time Management:
- Agile Methodology: Some searches relate to how to apply Agile principles to data projects.
- Task Prioritization: How to manage multiple data tasks simultaneously and prioritize effectively.
8. Knowledge of Data Privacy and Ethics:
- Data Security: Understanding how to handle sensitive data and privacy regulations (like GDPR) is increasingly searched as companies need to ensure compliance.
- Ethical Analysis: Searches sometimes touch on ensuring data analysis is ethical, with no bias or manipulation.
To summarize, users typically seek a combination of technical expertise, statistical knowledge, and communication skills. They also emphasize the importance of familiarity with tools and platforms (Excel, Python, Tableau), data preparation techniques, and the ability to translate data into actionable insights.
1. |
2. |
3. |
4. |
5. |
6. |
7. |
8. |
9. |
10. |
Programming Skills |
Data Visualization |
Statistical and Mathematical Skills |
Database Management & SQL |
Data Cleaning & Preprocessing |
Business Intelligence & Reporting |
Problem-Solving & Critical Thinking |
Communication & Storytelling with Data |
Basic Understanding of Machine Learning (Optional) |
Industry-Specific Knowledge |
Data analytics is today’s most in-demand field, helping businesses make data-driven decisions. Mastering the skills required for a successful data analyst is essential. Below are the key technical and soft skills required for a career in data analytics.
1.Programming Skills
Data analysts must be proficient in programming languages for data manipulation and analysis. The most commonly used languages include:
Python – Used for data analysis, visualization, and machine learning.
R – Popular for statistical analysis and data science applications.
SQL – Essential for querying databases and extracting relevant data.
1. Variables & Data Types
Python Example:
# Integer
age = 25
# Float
height = 5.9
# String
name = "Alice"
# Boolean
is_student = True

print("Name:", name)
print("Age:", age)
print("Height:", height)
print("Is Student:", is_student)
Output:
Name: Alice
Age: 25
Height: 5.9
Is Student: True
2. Operators
Python Example:
# Arithmetic Operators
a = 10
b = 3
print("Addition:", a + b)  # 10 + 3
print("Subtraction:", a - b)  # 10 - 3
print("Multiplication:", a * b)  # 10 * 3
print("Division:", a / b)  # 10 / 3
Output:
Addition: 13
Subtraction: 7
Multiplication: 30
Division: 3.3333
3. Control Flow
Python Example:
# If-else Statements
age = 18
if age >= 18:
    print("You are an adult.")
else:
    print("You are a minor.")
Output:
You are an adult.4. Functions
Python Example:
def greet(name, age):
    print(f"Hello, {name}! You are {age} years old.")

greet("Alice", 25)
greet("Bob", 30)
Output:
Hello, Alice! You are 25 years old.
Hello, Bob! You are 30 years old.
SQL Basics
Basic SELECT Query
SELECT * FROM Employees;SELECT with Specific Columns
SELECT first_name, last_name, salary FROM Employees;WHERE Clause (Filtering Data)
SELECT * FROM Employees WHERE salary > 50000;Key Skills Required for a Data Analyst
To excel in data analytics, mastering the skills required for a data analyst is crucial. These include:
Technical Skills: Proficiency in Python, R, and SQL.
Data Visualization: Knowledge of tools like Tableau, Power BI, or Matplotlib.
Statistics & Mathematics: Understanding probability, regression, and hypothesis testing.
Business Acumen: Ability to interpret data in a business context.
Communication Skills: Presenting insights clearly and concisely.
Problem-Solving Skills: Identifying
Explanation: These queries show how to use AND, OR, and NOT to filter results.
5. ORDER BY (Sorting Data)
Use ORDER BY to sort data by one or more columns:
— Select all employees, sorted by salary in descending order
SELECT * FROM Employees
ORDER BY salary DESC;
— Select all employees, sorted by department in ascending order
SELECT * FROM Employees
ORDER BY department ASC;
Explanation: The ORDER BY clause sorts the results by the specified column. Use ASC for ascending and DESC for descending order.
6. LIMIT (Limiting the Number of Results)
Use LIMIT to restrict the number of rows returned:
— Select the first 5 employees
SELECT * FROM Employees
LIMIT 5;
Explanation: This will return the first 5 rows from the Employees table.
7. JOIN (Combining Data from Multiple Tables)
Use JOIN to combine rows from two or more tables based on a related column:
— INNER JOIN: Select employees and their department names
SELECT Employees.first_name, Employees.last_name, Departments.department_name
FROM Employees
INNER JOIN Departments
ON Employees.department_id = Departments.department_id;
Explanation: This will return a list of employees along with their respective department names by matching department_id from both tables.
8. GROUP BY (Grouping Data)
Use GROUP BY to group rows that share a property:
— Select the average salary in each department
SELECT department, AVG(salary) AS avg_salary
FROM Employees
GROUP BY department;
Explanation: This query groups employees by department and calculates the average salary in each department.
9. HAVING Clause (Filtering Groups)
Use HAVING to filter groups after GROUP BY is applied:
— Select departments with an average salary greater than 60,000
SELECT department, AVG(salary) AS avg_salary
FROM Employees
GROUP BY department
HAVING AVG(salary) > 60000;
Explanation: The HAVING clause is used to filter the result of GROUP BY, unlike WHERE, which filters rows before grouping.
10. INSERT INTO (Inserting Data)
Insert new records into a table:
— Insert a new employee record
INSERT INTO Employees (first_name, last_name, department, salary)
VALUES (‘John’, ‘Doe’, ‘Marketing’, 55000);
Explanation: This will insert a new row into the Employees table with the specified values.
11. UPDATE (Modifying Data)
Use UPDATE to modify existing records:
— Update the salary of an employee
UPDATE Employees
SET salary = 60000
WHERE employee_id = 1;
Explanation: This query updates the salary of the employee with employee_id 1 to 60,000.
12. DELETE (Removing Data)
Use DELETE to remove records:
— Delete an employee record
DELETE FROM Employees
WHERE employee_id = 1;
Explanation: This query deletes the employee with employee_id 1 from the Employees table.
13. Subquery (Nested Queries)
Use a subquery to perform operations within another query:
— Select employees who earn more than the average salary
SELECT * FROM Employees
WHERE salary > (SELECT AVG(salary) FROM Employees);
Explanation: This query uses a subquery to calculate the average salary and return employees who earn more than the average.
14. ALTER TABLE (Modifying Table Structure)
Use ALTER TABLE to modify an existing table structure:
— Add a new column to the Employees table
ALTER TABLE Employees
ADD date_of_birth DATE;
Explanation: This query adds a new column called date_of_birth to the Employees table.
15. DISTINCT (Removing Duplicates)
Use DISTINCT to return only unique values:
— Select distinct departments
SELECT DISTINCT department
FROM Employees;
Explanation: This query returns a list of unique departments from the Employees table.
Summary:
1. Basic SELECT Query1. Basic SELECT Query1. Basic SELECT Query
- SELECT is used to query data.
- WHERE filters data based on conditions.
- ORDER BY sorts data.
- LIMIT restricts the number of rows returned.
- JOIN combines data from multiple tables.
- GROUP BY and HAVING help with aggregations.
- INSERT, UPDATE, and DELETE are for modifying data.
- Subqueries allow for complex queries.
- DISTINCT removes duplicate values.
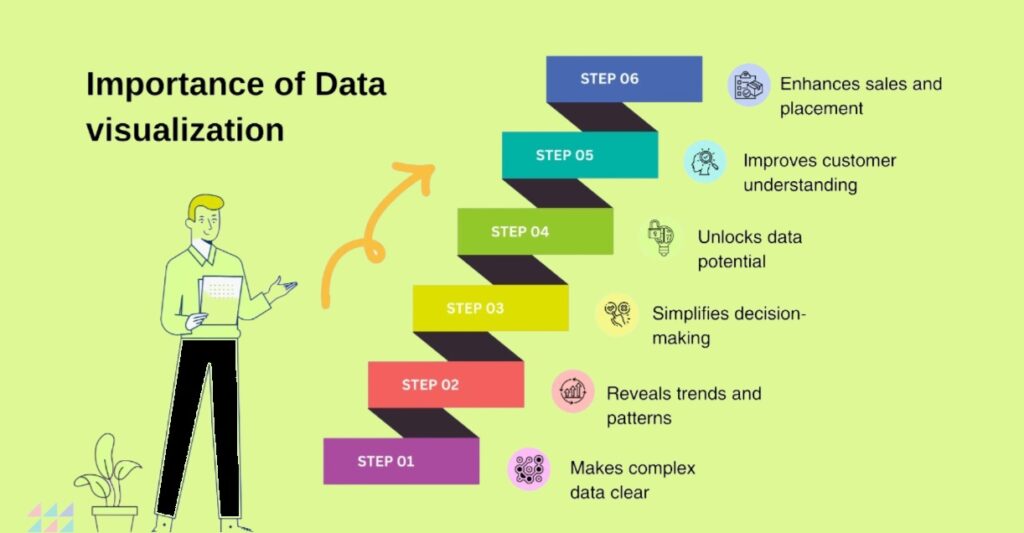
2. Data Visualization
Understandably presenting data is crucial. Analysts use visualization tools to create reports and dashboards. Some popular tools include:
- Tableau – A leading BI tool for interactive dashboards.
- Power BI – A Microsoft tool for business analytics.
- Excel _ still a powerful tool for data analysis and visualization.
3. Statistical and Mathematical Knowledge
A solid grasp of statistics is crucial for analyzing and interpreting data accurately. Key areas include:
- Descriptive and inferential statistics
- Hypothesis testing
- Regression analysis
4. Database Management & SQL
Data analysts work extensively with databases, requiring proficiency in SQL (Structured Query Language). Essential skills in this area include:
- Writing complex SQL queries
- Data extraction, transformation, and loading (ETL)
- Managing and optimizing relational databases
5. Data Cleaning & Preprocessing
Since raw data often contains inconsistencies, cleaning and preparing data is a key responsibility. A data analyst should be skilled in:
- Handling missing or incorrect values
- Identifying and removing duplicates
- Standardizing and transforming datasets
6.Business Intelligence & Reporting
Turning data into actionable insights is at the core of analytics. Analysts need to:
- Identify and track key performance indicators (KPIs)
- Develop interactive dashboards and reports
- Provide data-driven recommendations for business growth
7. Problem-Solving & Critical Thinking
One of the most essential skills required for a data analyst is the ability to think critically and solve problems. This involves:
- Recognizing patterns and correlations in data
- Using analytical methods to address business challenges
- Making informed decisions based on data insights
8. Communication & Storytelling with Data
Analyzing data is one thing; explaining it is another. Analysts should:
- Present insights in a simple, clear manner
- Create compelling reports and dashboards
- Use storytelling to help businesses understand data
9. Basic Understanding of Machine Learning (Optional)
- Basic knowledge of libraries such as Scikit-Learn, TensorFlow, or PyTorch.
- Implementing simple models using Python for data analysis.
- Selecting and transforming key features for better model accuracy.
- Handling missing values, outliers, and data normalization.
10.Industry Knowledge
- Understanding data privacy laws like GDPR, HIPAA, or industry-specific regulations.
- Ensuring ethical data usage and compliance with industry standards.
- Translating raw data into meaningful insights tailored to business goals.
- Recognizing patterns and trends relevant to the specific industry.
- Using specialized software like SAS for finance, Tableau for business intelligence, or Hadoop for big data.
- Adapting analytics methods to suit industry demands.
- Providing actionable recommendations based on industry insights.
- Helping businesses optimize operations, reduce costs, and improve efficiency through data-driven decisions.
11. Data Ethics and Privacy
- Understanding data privacy laws (GDPR, CCPA)
- Ethical data collection and usage
- Ensuring data security and compliance
12. Cloud Computing for Data Analytics
- Working with cloud-based data platforms (AWS, Google Cloud, Azure)
- BigQuery, Snowflake, and Redshift for large-scale data analytics
- Advantages of cloud storage and computing
13. ETL (Extract, Transform, Load) Processes
- Understanding data pipelines
- Extracting data from multiple sources
- Transforming data for analysis
14. Real-Time Data Processing
- Introduction to real-time analytics
- Tools like Apache Kafka and Spark
- Use cases in finance, IoT, and fraud detection
15. A/B Testing and Experimentation
- Understanding A/B testing and controlled experiments
- Applying statistical techniques to test business strategies
- Tools like Google Optimize and Optimizely
16. Big Data Technologies
- Hadoop and Spark for handling large datasets
- NoSQL databases like MongoDB and Cassandra
- Difference between structured and unstructured data
17. Web Scraping for Data Collection
- Using Python (BeautifulSoup, Scrapy) to extract data from websites
- Ethical considerations in web scraping
- Automating data collection for analysis
18. Advanced Excel for Data Analysis
- Pivot tables, VLOOKUP, and macros
- Power Query for data transformation
- Excel automation techniques
19. Time Series Analysis
- Forecasting trends using time-series data
- ARIMA, Prophet, and Exponential Smoothing models
- Real-world applications in finance, sales, and weather prediction.
20. Networking and Community Involvement
- Engaging in data science communities (Kaggle, GitHub, LinkedIn)
- Attending meetups, conferences, and hackathons
- Learning from industry experts and sharing knowledge
Frequently Asked Questions
1.What are the key technical skills for a Data Analyst?
SQL, Python/R, Excel, data visualization, and statistical analysis.
2. Is coding necessary for a Data Analyst?
Yes, SQL is essential, and Python or R is useful for advanced analysis.
3.Which software tools should a Data Analyst learn?
Excel, SQL, Tableau, Power BI, and Python/R for data analysis.
4. How important is SQL for Data Analysts?
- Very important! SQL is used to extract, manipulate, and analyze data from databases.
5. What statistical concepts should a Data Analyst know?
Descriptive statistics, probability, regression, hypothesis testing, and distributions.
6. Do Data Analysts need to know machine learning?
Not necessarily, but basic ML concepts can be helpful for predictive analysis.
7.What role does data visualization play in data analysis?
- It helps in presenting insights clearly using charts, graphs, and dashboards.
8. Is Excel still relevant for Data Analysts?
Yes! Excel is widely used for quick analysis, pivot tables, and basic visualizations.
9.How important is business acumen for a Data Analyst?
Crucial! Understanding business needs helps in delivering actionable insights.
10. What soft skills are required for a Data Analyst?
Problem-solving, communication, critical thinking, and attention to detail.

 in Hyderabad by Brolly.Group