
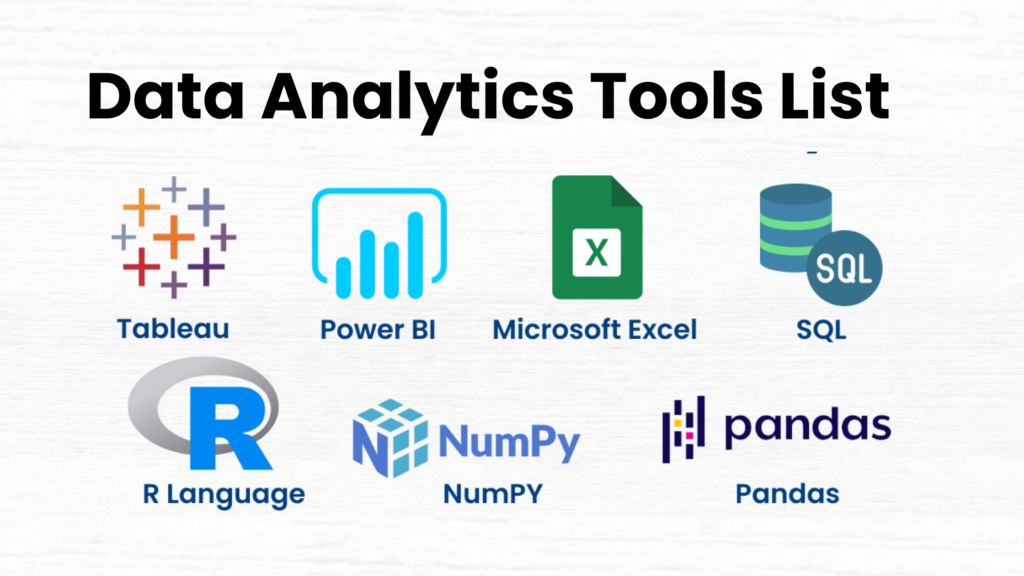
Data Analytics Tools List
Data Analytics Masters teaches important Data Analytics tools list that help you analyze data and find useful understandings.
Some of the key tools include Excel, which is used for basic data analysis and making charts, and SQL, which helps in storing and managing large amounts of data. Python and R are popular programming languages used for deeper analysis and making predictions.
Power BI and Tableau are tools that create easy-to-understand reports and dashboards. Google Analytics helps track website data, while Apache Spark is used for handling big data. Learning these tools helps you build strong skills and find good job opportunities in data analytics.
Data analytics plays a very important role in making smart decisions in different industries. As technology grows, businesses generate and collect more data than ever before. To make sense of this large amount of data, we need special tools that help in organizing, analyzing, and drawing useful insights from it.
These tools have evolved over time, starting from simple spreadsheet programs to advanced software that can predict trends using artificial intelligence and machine learning.
Some tools are easy to use and perfect for beginners, while others are designed for experts handling large and complex data. Here all tools used in Data Analytics are explained below with their key features.
- Spreadsheet Tools
- Business Intelligence (BI) Tools
- Statistical Tools
- Data Mining Tools
- Big Data Analytics Tools
- Machine Learning Tools
- Cloud-Based Analytics Tools
1. Spreadsheet Tools
Spreadsheet tools are very useful for working with data because they are easy to use and can be used for many different tasks. These tools help people organize, analyze, and display data in a simple way.
Many businesses and analysts use spreadsheets because they allow quick calculations, data entry, and creating charts or graphs. Small businesses find them helpful for managing finances, tracking sales, and making reports without needing advanced technical skills.
Key Features of Spreadsheet Tools:
1. Data entry, manipulation, and analysis.
2. Built-in formulas and statistical functions.
3. Data visualization (charts, graphs, pivot tables).
4. Collaboration and sharing capabilities.
a. Microsoft Excel
- Microsoft Excel is one of the most common tools for data analysis.
- It’s features are like pivot tables, charts, and formulas are fundamental for processing large datasets.
- It’s accessible, and many users are already familiar with its interface, making it an ideal starting point for novice analysts.
b. Google sheets
- Google Sheets is a cloud-based alternative to Excel.
- Its collaborative nature allows teams to work together in real-time, making it perfect for team-based analysis.
- This offers integration with various Google services, making it adaptable for many use cases.
Uses of Spreadsheet Tools:
- In Business – Financial modeling, budgeting, and expense tracking.
- In Education – Managing student records and performance tracking.
- In Data Analysis – Simple statistical calculations and trend analysis.
- In Project Management – Task tracking and Gantt chart creation.
2. Business Intelligence (BI) Tools
Business Intelligence (BI) tools help turn raw data into useful information that businesses can understand and use to make better decisions. These tools help organize data, create charts and reports, and show information in a visual way that is easy to understand.
With BI tools, businesses can track their performance, find patterns in data, and make informed choices. They also allow users to create dashboards, which are like interactive reports that show important business data in one place.
Key Features of BI Tools:
1. Data visualization (dashboards and reports).
2. Real-time analytics and data monitoring.
3. Data integration from multiple sources.
4. Predictive analytics and decision support.
a. Tableau
- Tableau is known for its powerful visualization capabilities and intuitive drag-and-drop interface.
- It can connect to various data sources like Excel, SQL databases, and cloud platforms.
- This is ideal for organizations that need to create interactive and real-time dashboards.
b. Power BI
- Power BI is a Microsoft offering that integrates seamlessly with Excel and other Microsoft products.
- This is excellent for users who already rely on Microsoft tools.
- It provides advanced data modeling and visualization capabilities.
- Power BI’s cloud service, Power BI Service, enables users to share dashboards and reports.
c. Qlik Sense
- Qlik Sense is known for its associative data model, enabling users to explore data from multiple angles.
- This offers both cloud and on-premise solutions.
- It has strong focus on self-service analytics, allowing users to perform analysis without depending on IT.
d. Looker (Google Cloud)
- Looker is a modern BI tool that allows users to explore and analyze data without needing to know SQL.
- It is highly customizable, allowing teams to build data models specific to their needs.
- Looker is acquired by Google in 2019, Looker integrates well with Google Cloud’s data products.
Uses of BI Tools:
- Entering data and doing simple math.
- Making charts, graphs, and tables to show data.
- Using formulas and shortcuts to save time on repeated tasks.
- Planning budgets, estimating future sales, and making reports.
- Studying sales patterns and what customers like.
- Checking if ads and promotions are working.
- Tracking progress and key goals.
- Guessing future trends and what customers will want.
3. Statistical Tools
Statistical tools are used by experts to study data in detail and find important patterns. These tools help in performing deep analysis, testing ideas with data, and making predictions about the future based on past trends.
Businesses, researchers, and scientists use these tools to understand data better, check if their assumptions are correct, and make smart decisions based on facts.
Key Features of Statistical Tools:
1. Advanced statistical modeling (e.g., regression, ANOVA).
2. Hypothesis testing and sampling analysis.
3. Data integration from multiple sources.
4. Predictive analytics and decision support.
a. R Language
- R language is an open-source statistical programming language.
- This offers extensive libraries for data analysis, statistical modeling, and visualization.
- It is popular among data scientists, researchers, and statisticians for its versatility.
b. Python (with Pandas, NumPy, and Matplotlib)
Python is a widely used programming language for data analysis and statistical computing. It is popular due to its simplicity, versatility, and vast ecosystem of libraries.
Pandas – Data manipulation and analysis
- Panda is used for handling structured data (tables, spreadsheets, databases).
- It provides functions for filtering, merging, grouping, and summarizing data.
NumPy – Numerical computing
- NumPy supports working with large multi-dimensional arrays and matrices.
- It provides mathematical and statistical functions like mean, median, and standard deviation.
Matplotlib & Seaborn – Data visualization
- Matplotlib is used for creating charts, graphs, and heatmaps to visualize data trends.
c. SAS (Statistical Analysis System)
- SAS is a robust software suite used for advanced analytics, multivariate analysis, business forecasting, and predictive modeling.
- It offers powerful tools for big data analytics and integrates well with other business systems.
d. SPSS (Statistical Package for the Social Sciences)
- SPSS is known for its ease of use, SPSS is widely used in academic and market research.
- It is primarily used for statistical analysis in social sciences but adaptable to other industries.
Uses of Statistical Tools:
- Studying medical test results and patient recovery.
- Checking risks and making smart investment choices.
- Collecting and studying survey data about people.
- Grouping customers based on their habits and preferences.
- Making dashboards to track sales, income, and key goals.
- Understanding what customers like and how they shop.
- Bringing together data from different places (databases, apps, spreadsheets).
- Guessing future business trends and making better decisions.
4. Data Mining Tools
Data mining tools help find useful information hidden in large amounts of data. These tools use special computer programs to look for connections, groups, and trends in the data.
Businesses use them to understand customer behavior, predict future trends, and make better decisions. For example, a store can use data mining to find out which products are often bought together and use this information to improve sales.
Key Features of Data Mining Tools:
1. Pattern recognition and anomaly detection.
2. Predictive modeling and clustering algorithms.
3. Handling large and unstructured data.
4. Association rule learning (e.g., market basket analysis).
a. RapidMiner
- RapidMiner is an open-source platform for data mining, machine learning, and advanced analytics.
- It provides a graphical user interface for users to design and deploy data mining models without coding.
- This is great for those new to data science but also includes advanced capabilities for experienced analysts.
b. KNIME
- KNIME is an open-source data analytics platform that supports data mining, machine learning, and predictive analytics.
- It has a user-friendly workflow-based interface, making it ideal for beginners and experts alike.
- KNIME features a vast library of extensions to integrate with other tools and systems.
c. Weka
- Weka is a collection of machine learning algorithms for data mining tasks.
- It is known for its easy-to-use graphical interface.
- Weka is widely used for academic research, though it is also utilized in various industries for machine learning applications.
Uses of Data Mining Tools:
- Studying what customers buy and how they shop.
- Finding fake or suspicious transactions.
- Discovering patterns in diseases and health risks.
- Grouping customers to send them personalized offers.
- Testing ideas and finding relationships between data.
- Examining survey answers and research results.
- Guessing future trends using math and statistics.
- Studying data over time to spot patterns and changes.
- Studying data over time to spot patterns and changes.
5. Big Data Analytics Tools
Big data analytics tools help businesses handle and understand huge amounts of information that regular tools cannot manage. These tools can quickly store, process, and analyze data, even as it is being created.
They help companies find important patterns and trends that can improve decision-making. For example, online stores use big data analytics to study customer shopping habits and suggest products they might like.
Key Features of Big Data Tools:
1. Distributed computing and parallel processing.
2. Real-time data streaming and analytics.
3. Scalability for large datasets.
4. Integration with cloud and on-premise environment.
a. Apache Hadoop
- Apache Hadoop is a framework that allows for the distributed processing of large datasets across clusters of computers.
- It is known for its scalability and ability to store and process petabytes of data.
- Hadoop ecosystem includes tools like Apache Spark for real-time data processing and HDFS for distributed file storage.
b. Apache Spark
- Apache Spark is a powerful open-source engine for big data processing.
- It is designed for speed and scalability, making it ideal for real-time data analysis.
- This supports machine learning, streaming analytics, and graph processing.
c. Google Big Query
- Google Cloud’s fully-managed, server less data warehouse.
- It is capable of analyzing large datasets quickly and efficiently using SQL queries.
- This is integrated with Google Cloud’s other tools, making it ideal for businesses invested in Google Cloud.
d. Amazon Redshift
- Amazon Web Services’ data warehouse service designed to handle petabytes of data.
- It supports complex queries and real-time analytics.
- It integrates with AWS tools and other BI platforms.
Uses of Big Data Tools:
- Studying how customers interact with a business and what they like.
- Handling and studying large amounts of data instantly.
- Using data from smart devices like sensors and home appliances.
- Watching stock market changes and guessing future trends.
- Finding security threats and unusual activities online.
- Organizing and studying huge amounts of customer information.
- Researching genes and analyzing medical data.
- Looking at government records and population data.
6. Machine Learning Tools
Machine learning tools help businesses create and use smart computer programs that can learn from data. These tools can make predictions, sort information into groups, find patterns, and understand relationships in data.
For example, online shopping websites use machine learning to recommend products based on what customers have previously bought. These tools help businesses make better decisions, automate tasks, and improve efficiency.
Key Features of Machine Learning Tools:
1. Supervised and unsupervised learning models.
2. Deep learning and neural network support.
3. Automation of feature selection and model tuning.
4. Integration with big data and cloud platforms.
a. TensorFlow
- It is an open-source framework developed by Google for building machine learning and deep learning models.
- It is highly flexible and scalable, TensorFlow can be used for everything from simple linear regression to complex neural networks.
- This is frequently used in research, academia, and production environments.
b. Scikit-learn
- Scikit-learn is a Python library for machine learning that provides easy-to-use tools for data analysis and predictive modeling.
- It is ideal for data scientists who want to perform tasks like classification, regression, clustering, and dimensionality reduction.
c. Keras
- Keras is a high-level neural networks API, Keras runs on top of TensorFlow and simplifies the process of building deep learning models.
- It is preferred for fast prototyping and experimentation with neural networks.
d. Apache Mahout
- It is a machine learning library designed for scalable data mining.
- It was built on top of Apache Hadoop, Mahout supports algorithms for clustering, classification, and collaborative filtering.
Uses of Machine Learning Tools:
- Guessing how diseases will develop and how well treatments will work.
- Using computer programs to trade stocks and assess credit risks.
- Suggesting products and tailoring offers for customers.
- Understanding customer opinions and predicting if they will leave.
- Finding out which customers might stop using a service.
- Spotting fraud by detecting unusual activities.
- Recognizing images and identifying faces.
- Understanding spoken words and processing human language.
7. Cloud-Based Analytics Tools
Cloud-based analytics tools are becoming more popular because they are easy to use, affordable, and can handle large amounts of data. These tools let businesses analyze data online without needing expensive computers or software.
Since everything is stored on the internet (cloud), companies can access their data from anywhere, at any time. This means businesses don’t have to spend a lot of money on setting up and maintaining their own data storage and processing systems.
Cloud analytics tools help companies make better decisions by providing real-time insights without requiring a big investment.
Key Features of Cloud Analytics Tools:
1. Scalable infrastructure for growing data needs.
2. Access from anywhere with an internet connection.
3. Secure storage and data encryption.
4. Cost-effective pay-as-you-go models.
a. Google Analytics
- Google Analytics is a powerful tool for tracking and analyzing website traffic and user behavior.
- It offers robust reporting, segmentation, and real-time data analysis features.
- This is ideal for marketers and website owners seeking insights into user engagement.
b. AWS Analytics
- Amazon Web Services offers a suite of cloud analytics tools, including AWS Glue, AWS Athena, and Amazon QuickSight.
- These tools support data processing, visualization, and machine learning, all in the cloud.
c. Microsoft Azure Analytics
- Azure offers a comprehensive suite of analytics tools for cloud-based data processing, business intelligence, and machine learning.
- Tools like Azure Synapse Analytics, Azure ML, and Power BI support end-to-end analytics capabilities.
Uses of Cloud Analytics Tools:
- Watching how customers behave online.
- Managing inventory efficiently with live data.
- Making accurate financial predictions and reports.
- Keeping patient records safe and analyzing them.
- Studying live data from websites and apps.
- Handling large amounts of data without using physical computers.
- Making instant dashboards to help businesses make decisions.
- Bringing together data from different cloud platforms.
Conclusion :
As data becomes more important in today’s world, choosing the right tool for analyzing it is key to making smarter decisions in your business. With so many data analytics tools available, each one offers something different depending on what you need. Some tools are great for simple tasks like organizing data, while others are built for complex tasks like machine learning or big data analysis.
The tools we’ve discussed in this blog represent a wide range of options. Whether you’re just starting out or you’re an experienced data professional, there’s a tool out there that will suit your specific needs. It’s important to think about what you want to achieve with your data, the size of the data you’re working with, how much technical knowledge you have, and whether the tool fits into your existing systems.
By understanding the strengths of each tool, businesses can better use data to drive decisions, find new opportunities, and solve problems. With the right tool, you can unlock the full potential of your data and make more informed choices for your company’s success.
Frequently Asked Questions and Answers
Q1: What is the best Data Analytics Tool for beginners?
Answer : If you’re new to data analytics, start with Microsoft Excel or Google Sheets. They are simple to use and help with basic calculations, charts, and reports. Once you’re comfortable, you can move on to more advanced tools like Power BI, Tableau, or Python.
Q2: Why are Data Analytics Tools important?
Answer: These tools make it easier to find useful insights from large amounts of data. They help in:
- Making better business decisions
- Finding trends and patterns
- Predicting future outcomes
- Automating repetitive tasks
- Improving efficiency and accuracy
Q3: What are the best free Data Analytics Tools?
Answer: Some popular free data analytics tools include:
- Google Sheets (for spreadsheets and basic analysis)
- Tableau Public (for free data visualization)
- Google Data Studio (for creating free reports and dashboards)
- KNIME (for free data mining and automation)
- R and Python (for advanced analytics and machine learning)
Q4: How do Data Analytics Tools help in business growth?
Answer: These tools help businesses by:
- Understanding customer behavior
- Improving marketing strategies
- Reducing risks and fraud
- Increasing sales and profits
- Automating reports and data processing
Q5: Can I use Excel for Data Analytics?
Answer: Yes! Excel is a great tool for basic data analysis. You can:
- Organize data in tables
- Use formulas for calculations
- Create charts and pivot tables
- Perform basic statistical analysis
For advanced analytics, you may need Power BI, Python, or Tableau.
Q6: What is the easiest Data Analytics Tool to learn?
- Excel (for beginners) – Best for basic calculations and reports
- Power BI (for dashboards) – Easy to use for business reporting
- Google Data Studio (for free online reporting) – Simple and cloud-based
Q7: What tools are used in Healthcare Analytics?
Answer: Healthcare analytics helps hospitals and researchers study diseases, patient records, and treatments. Some useful tools are:
- R and Python – For medical data analysis
- SAS – For handling clinical trial data
- Google Cloud Healthcare API – For managing health data securely
Q8:Can Data Analytics Tools help prevent fraud?
Answer: Yes, Fraud detection tools analyze large amounts of transactions to find unusual activity. Examples:
- IBM Watson – Uses AI to detect fraud in banking
- SAS Fraud Management – Monitors financial transactions for fraud risks
- Python with Machine Learning – Can build custom fraud detection models
Q9: What is the difference between Data Mining and Data Analytics?
Answer: Data Mining is about discovering hidden patterns in large datasets. It finds relationships between data points (e.g., “People who buy phones also buy phone cases”).
Data Analytics is a broader term that includes collecting, cleaning, analyzing, and visualizing data to make decisions.
Q10: What are some real-life examples of Data Analytics in action?
Answer: Data analytics is used in many industries:
- Retail – Stores track customer purchases to suggest products.
- Healthcare – Hospitals study patient data to improve treatments.
- Banking – Banks use analytics to detect fraud.
- Sports – Teams analyze player performance for better strategies.
- Social Media – Platforms recommend posts and ads based on user behavior.
Q11: What is the difference between Data Analytics and Data Science?
Answer: Data Analytics focuses on analyzing past data to find insights.
Data Science goes deeper, using AI and machine learning to predict future trends.
Q12: What is the role of SQL in Data Analytics?
Answer: SQL (Structured Query Language) is used to:
- Store and retrieve data from databases.
- Filter and sort large datasets.
- Combine data from multiple sources.
Tools like MySQL, PostgreSQL, and Microsoft SQL Server are commonly used for data analytics.
Q13: What are some challenges in Data Analytics?
Answer: Common problems include:
- Too much data – Hard to manage big datasets.
- Bad data quality – Missing or incorrect information.
- Security risks – Protecting sensitive data.
- Choosing the right tools – Many tools are available, but not all are useful.
Solution: Businesses use cloud storage, data cleaning tools, and security measures to solve these challenges.

 in Hyderabad by Brolly.Group