
Data Analytics Project to Boost Your Skills 2025

Data Analytics Project Ideas:
- Sales Performance Dashboard:
Description: Create an interactive dashboard using Tableau or Power BI to visualize a company’s sales performance.
- What to Include:
- Monthly sales trends.
- Regional sales breakdown.
- Top-performing products.
- Customer demographics analysis.
- Why It’s Great: Demonstrates data visualization, business insights, and storytelling skills.
- Predict Customer Churn:
Description: Use Python or R to analyze customer data and predict which customers will likely leave a service.
- Techniques:
- Logistic Regression or Random Forest models.
- Feature engineering (e.g., analyzing usage patterns).
- Why It’s Great: Shows machine learning proficiency and business problem-solving.
- Sentiment Analysis for Social Media:
- Description: Scrape Twitter, Instagram, or Reddit data and analyze public sentiment about a specific topic or brand.
- Tools:
- Python (NLTK, TextBlob, or spaCy).
- Tableau for visualizing sentiment trends.
- Why It’s Great: Highlights natural language processing (NLP) and text analytics expertise.
- Retail Inventory Optimization:
Description: Analyze historical sales data to help a retailer optimize inventory levels and reduce overstock/understock.
What to Include:
- Demand forecasting.
- Safety stock level calculations.
- Inventory cost optimization.
Why It’s Great: Solves a practical, high-impact business problem.
- Fraud Detection System:
Description: Build a system to detect anomalies in financial transactions.
Techniques:
- Use machine learning algorithms like Isolation Forest or Autoencoders.
- Visualize anomalies with Python libraries like Matplotlib or Seaborn.
Why It’s Great: Demonstrates ability to work with complex datasets and security-focused analytics.
- Employee Attrition Analysis:
Description: Analyze HR data to predict employee turnover and identify factors contributing to attrition.
- Techniques:
- Logistic Regression, Decision Trees, or Support Vector Machines.
- Statistical analysis of workplace satisfaction and compensation.
- Why It’s Great: Addresses human resource challenges using analytics.
- Market Basket Analysis:
Description: Use transactional data to identify product association rules (e.g., customers buying X often buy Y).
- Techniques:
- Apriori or FP-Growth algorithm for association rule mining.
- Why It’s Great: Great for showcasing data mining and pattern recognition skills.
- COVID-19 Data Analysis:
Description: Analyze COVID-19 datasets to identify trends and correlations.
- Focus Areas:
- Case growth trends over time.
- Vaccine distribution insights.
- Mortality rates by region or demographics.
- Why It’s Great: Demonstrates ability to work with large, real-world datasets.
- Stock Market Price Prediction:
Description: Predict stock prices using historical data and machine learning algorithms.
- Techniques:
- LSTM (Long Short-Term Memory Networks) for time series forecasting.
- Data visualization for trends and correlations.
- Why It’s Great: Combines finance knowledge with data science skills.
- Energy Consumption Analysis:
Description: Analyze energy usage data for residential or industrial areas to identify savings opportunities.
What to Include:
- Peak usage times.
- Seasonal trends.
- Predictive analysis for future energy needs.
Why It’s Great: Appeals to companies focusing on sustainability and energy efficiency.
- E-Commerce Recommendation System:
Description: Create a recommendation engine for e-commerce platforms to suggest products to users.
Techniques:
- Collaborative filtering or content-based filtering.
- Evaluate model performance using metrics like RMSE.
Why It’s Great: Showcases knowledge of algorithms and personalization.
- Customer Lifetime Value (CLV) Analysis:
Description: Analyze customer purchase data to calculate CLV and recommend strategies to improve it.
- Techniques:
- RFM (Recency, Frequency, Monetary) modeling.
- Visualization of high-value customer segments.
- Why It’s Great: Demonstrates advanced business analytics capabilities.
- Healthcare Data Analysis:
Description: Analyze patient data to identify trends, such as predicting hospital readmission rates or analyzing disease prevalence.
- What to Include:
- Use clustering for patient segmentation.
- Visualize key trends with Tableau or Power BI.
- Why It’s Great: Shows industry-specific analytics expertise.
- Traffic Accident Analysis
Description: Analyze public traffic accident datasets to identify accident-prone areas and factors contributing to accidents.
Techniques:
- Geospatial analysis using tools like QGIS.
- Predictive modeling for accident severity.
Why It’s Great: Combines analytics with public safety insights.
- Fitness Tracker Data Analysis
Description: Analyze data from fitness trackers to provide personalized health insights (e.g., activity trends, calorie burn).
Tools: Python (Pandas, Matplotlib), Excel for data cleaning and visualization.
Why It’s Great: Highlights data-driven insights for personal health and wellness.

- Perform advanced data analysis to help businesses make data-driven decisions.
- Design and manage interactive dashboards for real-time insights and reporting.
- Apply predictive analytics to forecast trends and optimize business strategies.
How to Start Your First Data Analytics Project for Students
First Data analytics project can feel overwhelming, but you can make it manageable and rewarding with the right approach. Here’s a step-by-step guide to help you get started:
- Choose a Simple Problem: Begin with a project with a clear objective that interests you. For example, analyze your favorite store’s sales data or trends in movie ratings.
- Find a Dataset: Look for publicly available datasets on platforms like Kaggle, UCI Machine Learning Repository, or government websites. Ensure the dataset aligns with your project’s goals.
- Define Your Goals: Determine what you want to achieve, such as identifying patterns, creating visualizations, or building a predictive model.
- Clean the Data: Preprocessing is crucial. Handle missing values, remove duplicates, and transform the data to make it analysis-ready.
- Use the Right Tools: Start with beginner-friendly tools like Excel for basic analysis or Python/R for more advanced tasks. Libraries like Pandas, Matplotlib, and Scikit-learn are great for data manipulation and modeling.
- Visualize Your Findings: Create charts or dashboards to present your insights.
- Building your expertise in data analytics requires hands-on experience.
Engaging in diverse data analytics projects helps you understand the practical applications of tools and techniques.
1. Customer Segmentation Project
- Goal: Analyze customer data to group them based on purchasing behavior.
- Skills Developed: Data preprocessing, clustering algorithms like K-Means, and customer behavior analysis.
- Tools Used: Python, R, or Tableau for data visualization.
2. Sales Forecasting Project
- Goal: Predict future sales based on historical data.
- Skills Developed: Time-series analysis, regression models, and trend forecasting.
- Tools Used: Excel, Python (with libraries like Pandas and Prophet).
- 3. Social Media Sentiment Analysis
- Goal: Analyze social media data to understand public sentiment about a product or service.
- Skills Developed: Text mining, natural language processing (NLP), and sentiment classification.
- Tools Used: Python (NLTK or SpaCy libraries) and APIs for data collection.
4. Data Visualization Dashboard
- Goal: Create an interactive dashboard to present key insights from a dataset.
- Skills Developed: Data visualization, storytelling with data, and dashboard design.
- Tools Used: Tableau, Power BI, or Python libraries like Plotly.
5. Fraud Detection Project
- Goal: Identify fraudulent transactions using financial data.
- Skills Developed: Anomaly detection, machine learning classification models, and feature engineering.
- Tools Used: Python, R, or cloud platforms like AWS SageMaker.
6. Healthcare Analytics Project
- Goal: Analyze patient data to identify trends in disease prevalence or treatment outcomes.
- Skills Developed: Data cleaning, statistical analysis, and domain-specific insights.
- Tools Used: Python, SQL, and healthcare datasets like UCI or Kaggle.
7. E-Commerce Recommendation System
- Goal: Build a recommendation system to suggest products to users.
- Skills Developed: Collaborative filtering, content-based filtering, and recommendation algorithms.
- Tools Used: Python (libraries like Scikit-learn or TensorFlow).
Data Analytics Project: Building a Portfolio for Future Opportunities
Why Build a Data Analytics Portfolio?
- A portfolio showcases your skills, experience, and practical knowledge.
- Helps employers quickly assess your capabilities and problem-solving skills.
- Increases your chances of landing interviews by demonstrating your hands-on work.
Choosing the Right Data Analytics Project
- Select projects that highlight various aspects of data analytics like data cleaning, visualization, and modeling.
- Focus on projects with real-world datasets to demonstrate your ability to handle practical challenges.
- Include both beginner-level and advanced projects to show growth and adaptability.
- Project Types to Include in Your Portfolio
- Data Cleaning and Preprocessing: Showcase how you can handle missing data, outliers, and transformations.
- Data Visualization: Demonstrate your ability to visualize insights using tools like Tableau, Power BI, or Python libraries.
- Predictive Analytics: Include projects where you’ve built and tested predictive models using machine learning techniques.
- Business Analytics: Highlight projects that solve real business problems, such as customer segmentation or sales forecasting.
- How to Present Your Data Analytics Project
- Include clear documentation and a step-by-step explanation of your work process.
- Add visual elements like graphs, charts, or dashboards to make your projects visually appealing.
- Write detailed descriptions to explain the problem, the approach, the tools used, and the outcomes.
- How Many Data Analytics Projects Should You Include?
- Quality over quantity: 4-6 well-executed projects are better than many unfinished ones.
- Showcase diversity: Include projects that cover various domains (e.g., healthcare, finance, e-commerce).
- Tools and Technologies to Highlight
- Be sure to mention any popular tools you’ve used, such as Python, R, SQL, Excel, Tableau, or machine learning libraries.
- If applicable, highlight your experience with cloud platforms (like AWS or Google Cloud) or big data tools (like Hadoop or Spark).
- Sharing Your Portfolio
- Create an online portfolio through GitHub, LinkedIn, or personal websites.
- Make sure it’s easily accessible and well-organized to leave a positive impression on potential employers.
- Keep Improving Your Portfolio
- Regularly update your portfolio with new data analytics projects to show continuous learning.
- Stay engaged with the latest industry trends and incorporate cutting-edge techniques into your work.
Real-World Data Analytics Project for All Levels
Data Analytics Project is an effective way to gain practical experience, improve your skills, and build a portfolio that showcases your expertise. Whether you’re just starting or are an experienced professional, there are projects suited for every level. Here are some examples and ideas:
1. Beginner-Level Data Analytics Project
At this level, the focus is on understanding data structures, basic analysis, and visualization.
Example 1: Retail Sales Analysis
- Objective: Analyze the sales data of a small retail store to identify best-selling products and seasonal trends.
- Dataset: Download publicly available datasets like Walmart Sales or create a custom dataset in Excel.
- Skills Developed: Data cleaning, aggregation, and visualization.
- Tools Used: Excel, Google Sheets, or Python (Pandas and Matplotlib).
Example 2: Movie Ratings Analysis
- Objective: Analyze datasets from IMDB or Kaggle to identify trends in movie genres, ratings, and release years.
- Skills Developed: Exploratory data analysis (EDA), basic filtering, and data visualization.
- Tools Used: Python libraries such as Seaborn or Matplotlib.
Example 3: Customer Demographics Analysis
- Objective: Understand customer segmentation based on age, income, and location from a simple dataset.
- Dataset: Public datasets on demographics or marketing campaigns.
- Skills Developed: Data manipulation, visualization, and identifying trends.
- Tools Used: Tableau, Power BI, or Python.
2. Intermediate-Level Data Analytics Project
Intermediate projects require working with larger datasets and applying statistical techniques or machine learning models.
Example 1: Social Media Sentiment Analysis
- Objective: Analyze tweets or Facebook comments to determine public sentiment about a product or event.
- Dataset: Extract data using APIs like Twitter API.
- Skills Developed: Text preprocessing, sentiment classification, and visualization.
- Tools Used: Python (NLTK, TextBlob, or SpaCy).
Example 2: Weather Trends Analysis
- Objective: Analyze historical weather data to identify seasonal trends or temperature variations over time.
- Dataset: NOAA or Kaggle weather datasets.
- Skills Developed: Time-series analysis, anomaly detection, and advanced visualization.
- Tools Used: Python (Pandas, Matplotlib) or Tableau.
Example 3: E-Commerce Recommendation System
- Objective: Build a recommendation engine to suggest products to users based on their purchase history.
- Dataset: E-commerce datasets from Kaggle.
- Skills Developed: Collaborative filtering, content-based filtering, and implementing algorithms.
- Tools Used: Python (Scikit-learn or TensorFlow).
3. Data analytics projects for final year students
Advanced projects deal with large-scale datasets and require a deep understanding of machine learning and statistical modeling.
Example 1: Fraud Detection in Financial Transactions
- Objective: Detect fraudulent transactions from financial data using classification models.
- Dataset: Kaggle’s Credit Card Fraud Detection dataset.
- Skills Developed: Anomaly detection, feature engineering, and machine learning evaluation metrics.
- Tools Used: Python (Scikit-learn, XGBoost).
Example 2: Healthcare Analytics for Patient Outcomes
- Objective: Predict treatment outcomes based on patient data to identify high-risk patients.
- Dataset: Healthcare datasets from UCI or public health repositories.
- Skills Developed: Predictive modeling, advanced statistical analysis, and domain knowledge in healthcare.
- Tools Used: Python, R, or cloud platforms like AWS SageMaker.
Example 3: Customer Churn Prediction
- Objective: Predict which customers are likely to leave a subscription-based service using historical interaction data.
- Dataset: Kaggle churn datasets or custom CRM data.
- Skills Developed: Machine learning classification, model evaluation, and data preprocessing.
- Tools Used: Python or R with libraries like Scikit-learn or TensorFlow.
Example 4: Big Data Analysis with Apache Spark
- Objective: Process and analyze large datasets to identify business insights, such as sales patterns or user behavior.
- Dataset: Public big data repositories or large-scale business datasets.
- Skills Developed: Distributed computing, big data frameworks, and parallel processing.
- Tools Used: Apache Spark, Hadoop.
Benefits of Working on Data Analytics Projects
- Practical Experience: Gain hands-on experience with tools and techniques.
- Portfolio Building: Showcase your skills to potential employers or clients.
- Problem-Solving: Learn to tackle real-world challenges.
- Skill Advancement: Stay updated with the latest trends in data analytics.
Data Analytics Project is essential for learners and professionals alike. Whether you’re a beginner analyzing simple datasets or an expert building complex predictive models, these projects help you hone your skills and prepare for real-world challenges. Start with projects that align with your interests and gradually take on more complexity to become a proficient data analyst.
Advanced-Data Analytics Project to Challenge Your Expertise
1. Energy Consumption Forecasting for Smart Grids
- Objective: Predict energy demand and optimize grid performance using historical consumption data.
- Dataset: Use energy datasets from Kaggle or open energy platforms.
- Approach:
- Perform time-series analysis using models like ARIMA, SARIMA, or Prophet.
- Analyze factors such as weather conditions, peak hours, and historical trends.
- Develop a dashboard to monitor real-time energy consumption and predictions.
- Skills Developed: Time-series forecasting, energy data analytics, and predictive modeling.
- Tools: Python, Tableau, or Power BI.
2. Credit Risk Assessment for Financial Institutions
- Objective: Build a model to assess the creditworthiness of loan applicants.
- Dataset: Use loan datasets from Kaggle or UCI.
- Approach:
- Perform feature engineering on applicant data, such as income, credit score, and debt-to-income ratio.
- Train classification models like Logistic Regression or Gradient Boosting.
- Evaluate the model using metrics like AUC-ROC and precision-recall.
- Skills Developed: Risk analytics, classification modeling, and feature importance analysis.
- Tools: Python (Scikit-learn, XGBoost), R.
3. Optimizing Supply Chain Logistics
- Objective: Analyze and optimize supply chain operations, including inventory management and delivery routes.
- Dataset: Use logistics datasets from Kaggle or proprietary business data.
- Approach:
- Identify bottlenecks and inefficiencies in the supply chain.
- Use clustering algorithms for warehouse optimization and route planning.
- Apply predictive models to forecast inventory needs.
- Skills Developed: Supply chain analytics, optimization techniques, and clustering.
- Tools: Python (SciPy, Gurobi), Tableau.
4. Image Recognition for Quality Control
- Objective: Use computer vision techniques to identify defective products on manufacturing lines.
- Dataset: Generate labeled image datasets or use open-source datasets.
- Approach:
- Train deep learning models like Convolutional Neural Networks (CNNs).
- Perform image augmentation to improve model robustness.
- Deploy the model for real-time defect detection in production.
- Skills Developed: Computer vision, deep learning, and image processing.
- Tools: TensorFlow, PyTorch, OpenCV.
5. Natural Disaster Analysis and Prediction
- Objective: Predict the likelihood of natural disasters like floods or earthquakes using historical data.
- Dataset: Access datasets from government agencies or Kaggle.
- Approach:
- Analyze historical weather patterns, seismic activity, and environmental conditions.
- Use machine learning models to predict disaster occurrences.
- Visualize risk-prone areas using geospatial analytics.
- Skills Developed: Predictive modeling, geospatial analysis, and environmental data analytics.
- Tools: Python, QGIS, or Tableau.
6. Real-Time Stock Market Analysis
- Objective: Analyze and predict stock prices using real-time market data.
- Dataset: Use APIs like Alpha Vantage or Quandl for live stock data.
- Approach:
- Preprocess data by normalizing and handling missing values.
- Use LSTM networks for time-series forecasting.
- Create dashboards to monitor stock trends and predictions.
- Skills Developed: Financial analytics, deep learning, and real-time data processing.
- Tools: Python (TensorFlow, Keras), Tableau.
7. Dynamic Pricing Strategy for E-Commerce
- Objective: Develop a model to optimize pricing strategies based on demand, competition, and customer behavior.
- Dataset: E-commerce sales and pricing datasets from Kaggle.
- Approach:
- Analyze historical sales data and competitor pricing trends.
- Use regression models or reinforcement learning for dynamic pricing.
- Build dashboards to simulate pricing strategies and predict outcomes.
- Skills Developed: Pricing analytics, regression modeling, and customer behavior analysis.
- Tools: Python, Tableau, or Power BI.
8. Traffic Accident Analysis and Prevention
- Objective: Identify factors contributing to traffic accidents and suggest preventive measures.
- Dataset: Use accident datasets from Kaggle or government traffic databases.
- Approach:
- Analyze accident data based on location, time, and weather conditions.
- Use clustering algorithms to identify high-risk zones.
- Suggest policy measures based on data-driven insights.
- Skills Developed: Geospatial analysis, clustering, and policy analytics.
- Tools: Python (Folium, Geopandas), QGIS.
9. Real Estate Price Prediction
- Objective: Predict real estate prices based on location, amenities, and market trends.
- Dataset: Use real estate datasets from Kaggle or property websites.
- Approach:
- Perform EDA to identify key price determinants.
- Train regression models like Ridge, Lasso, or Gradient Boosting.
- Develop interactive dashboards for price prediction.
- Skills Developed: Regression analysis, market analytics, and visualization.
- Tools: Python, Tableau, or R.
10. Analyzing Cryptocurrency Trends
- Objective: Analyze cryptocurrency trends and predict future price movements.
- Dataset: Use APIs like CoinGecko or CryptoCompare.
- Approach:
- Perform sentiment analysis on cryptocurrency forums or social media.
- Use LSTM models to predict future price trends.
- Visualize findings in an interactive dashboard for better decision-making.
- Skills Developed: Cryptocurrency analytics, deep learning, and sentiment analysis.
- Tools: Python (Keras, Seaborn), Tableau.
These advanced data analytics project cater to professionals seeking to expand their knowledge and solve complex problems across diverse domains. By taking on challenges such as fraud detection, supply chain optimization, or dynamic pricing, you can build expertise in high-demand areas and develop solutions that make a tangible impact.
Additional Tools and Technologies for Successful Data Analytics Project
To further enhance your capabilities in data analytics project, here are more tools and technologies that cater to specialized needs, improve efficiency, and streamline workflows.
11. Real-Time Analytics Tools
Real-time analytics tools process and analyze data as it is generated, providing immediate insights.
- Apache Flink: Designed for stream and batch processing of large datasets.
- Google Dataflow: Cloud-based service for stream and batch data analytics.
- Kinesis by AWS: Handles real-time data streaming and analytics.
- Application: These tools are ideal for real-time stock market analysis or monitoring social media trends.
12. Business Intelligence (BI) Tools
BI tools enable organizations to visualize and derive actionable insights from data.
- Looker: A cloud-based BI tool for creating interactive dashboards.
- QlikView: Offers fast analytics and customizable dashboards.
- Sisense: Provides end-to-end BI solutions for advanced analytics.
- Application: Use BI tools for projects like customer segmentation and operational efficiency analysis.
13. Data Integration Tools
Data integration tools combine data from multiple sources into a unified format.
- Talend: An open-source tool for data integration and transformation.
- Informatica: Provides enterprise-level solutions for data integration and governance.
- Apache Nifi: Facilitates seamless data flow across various systems.
- Application: Use these tools for integrating disparate datasets in projects such as supply chain optimization or fraud detection.
14. Data Annotation Tools
For projects involving machine learning, annotated data is crucial.
- Labelbox: A platform for labeling and managing training data.
- SuperAnnotate: For annotating images, videos, and text data.
- Dataloop: Streamlines annotation for AI and machine learning models.
- Application: Use these tools for data annotation in computer vision projects like defect detection or medical imaging.
15. Geospatial Analytics Tools
Geospatial tools analyze location-based data for insights.
- ArcGIS: The industry standard for mapping and geospatial analytics.
- Google Earth Engine: Processes satellite imagery and geospatial data.
- PostGIS: Extends PostgreSQL for geospatial data handling.
- Application: Ideal for projects like natural disaster analysis or urban planning.
16. Statistical Analysis Tools
For advanced statistical modeling, these tools are highly effective.
- Minitab: A tool for performing statistical analyses and quality improvement projects.
- SPSS: IBM’s statistical software for detailed data analysis.
- Stata: A tool for econometrics, statistical modeling, and data visualization.
- Application: These tools are perfect for projects such as healthcare outcome analysis or economic forecasting.
17. Workflow Automation Tools
Automation tools streamline repetitive tasks in data pipelines.
- Apache Airflow: For designing and managing data workflows.
- Luigi: A Python package for building complex pipelines.
- Perfect: A modern workflow orchestration tool for data teams.
- Application: Use workflow automation for automating ETL (Extract, Transform, Load) tasks in projects like sales analytics or marketing campaign evaluation.
18. Advanced Machine Learning Platforms
For sophisticated machine learning workflows, these platforms are invaluable.
- Google Vertex AI: A unified AI platform for deploying and scaling ML models.
- Azure Machine Learning Studio: A collaborative environment for building AI solutions.
- Hugging Face: Offers pre-trained models and tools for NLP tasks.
- Application: Develop projects such as personalized recommendation systems or advanced NLP-based chatbots.
19. Web Scraping Tools
For extracting data from websites, web scraping tools are indispensable.
- BeautifulSoup: A Python library for parsing HTML and XML documents.
- Scrapy: A powerful framework for large-scale web scraping.
- Octoparse: A no-code scraping tool for non-technical users.
- Application: Gather data for projects like e-commerce price analysis or product review sentiment analysis.
20. Data Encryption and Privacy Tools
Maintaining data privacy is critical in analytics projects.
- VeraCrypt: For encrypting sensitive data files.
- AWS Key Management Service (KMS): Manages encryption keys for secure data storage.
- Snowflake: Offers built-in data encryption for cloud analytics.
- Application: Use these tools for projects involving sensitive data, such as healthcare analytics or financial risk assessment.
21. A/B Testing Tools
For analyzing user behavior and optimizing processes, A/B testing tools are essential.
- Optimizely: A platform for running experiments and tests.
- Google Optimize: Free A/B testing tool for website optimization.
- Split.io: Manages feature flags and experiments.
- Application: Ideal for marketing analytics projects or user experience testing.
22. Open-source Data Repositories
Accessing quality datasets is crucial for successful data analytics projects.
- Kaggle Datasets: A vast library of datasets for diverse analytics projects.
- Google Dataset Search: Helps discover datasets across various domains.
- Data.gov: U.S. government’s open data platform.
- Application: Source datasets for projects like energy forecasting or crime data analysis.
Conclusion
Mastering a wide range of tools and technologies is essential for tackling diverse Data analytics project. From data collection and preprocessing to advanced analytics and visualization, these tools enable you to create impactful solutions that address real-world challenges. By leveraging these resources, you can enhance your expertise and deliver exceptional results in the rapidly evolving field of data analytics.
Frequently Asked Questions
1.What is a data analytics project?
- A data analytics project involves collecting, cleaning, analyzing, and visualizing data to extract meaningful insights and solve real-world problems.
2. What are some good beginner-friendly data analytics projects?
- Sales Analysis (Analyze sales trends using Excel/SQL)
- Customer Churn Prediction (Use Python and ML)
- E-commerce Data Analysis (Analyze customer behavior)
- COVID-19 Data Visualization (Use Tableau/Power BI)
- Stock Market Analysis (Use Pandas & Matplotlib)
3. What tools are commonly used in data analytics projects?
- Data Cleaning: Python (Pandas), Excel
- Data Analysis: SQL, Python, R
- Data Visualization: Tableau, Power BI, Matplotlib, Seaborn
- Big Data Processing: Spark, Hadoop
4. Where can I find datasets for data analytics projects?
- Kaggle (https://www.kaggle.com/)
- Google Dataset Search
- UCI Machine Learning Repository
- Government open data portals
5. How do I choose the right dataset for my project?
Look for clean datasets, relevant to your goal, and have enough data points to generate meaningful insights.
6. What are some advanced data analytics project ideas?
- Sentiment Analysis on Social Media
- Fraud Detection in Banking
- Customer Segmentation using Clustering
- Demand Forecasting for Retail
- HR Analytics (Predicting Employee Attrition)
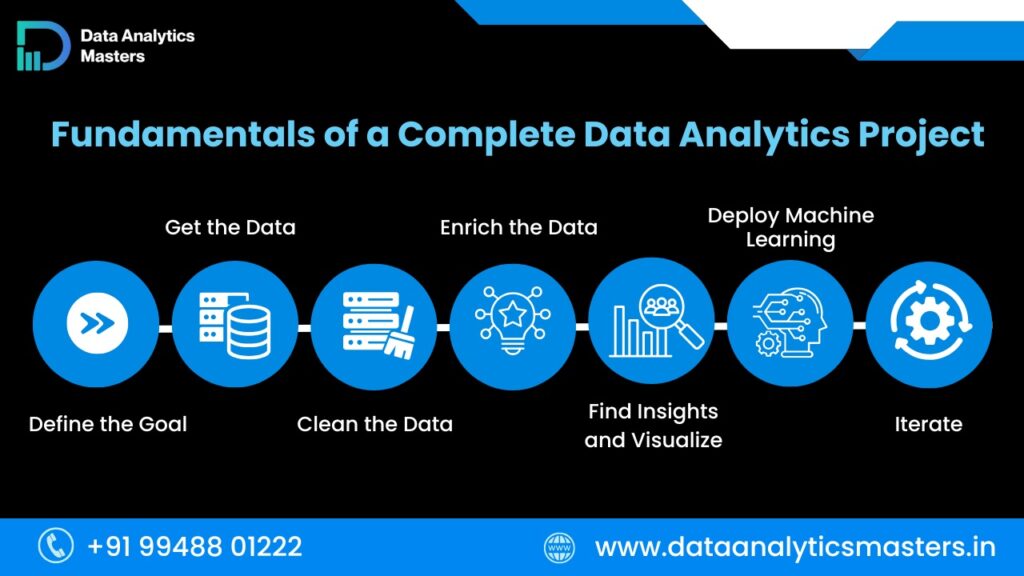
7. How do I structure a data analytics project?
- Step 1: Define the problem statement
- Step 2: Collect the data
- Step 3: Clean and preprocess the data
- Step 4: Perform exploratory data analysis (EDA)
- Step 5: Apply statistical analysis/machine learning
- Step 6: Visualize and interpret the results
- Step 7: Summarize findings and recommendations
8. Do I need coding skills for a data analytics project?
Not always. Some projects can be done using Excel, Power BI, or Tableau, but Python and SQL increase efficiency and depth of analysis.
9.How do I present my data analytics project in a resume?
- Mention the project title
- List the tools & technologies used
- Describe the problem, approach, and impact
- Quantify results if possible (e.g., “Reduced processing time by 30%”)
10.What are some industry-specific data analytics projects?
- Healthcare: Predicting disease outbreaks
- Finance: Credit risk analysis
- Retail: Customer purchasing trends
- E-commerce: Recommendation systems
- Marketing: Ad performance analysis
11. How do I explain my data analytics project in an interview?
- Start with the problem statement
- Explain the tools & techniques used
- Discuss the key findings and insights
- Mention any challenges and how you solved them
12. Can I use Power BI or Tableau for a data analytics project?
Yes! You can create interactive dashboards to visualize trends, sales, customer behavior, and more.
13. How long does it take to complete a data analytics project?
- Beginner project: 1-2 weeks
- Intermediate project: 3-4 weeks
- Advanced project: 1-2 months
14. Do personal projects help in getting a data analytics job?
Absolutely! Showcasing projects on GitHub or LinkedIn proves your skills and helps in job applications.
15. What’s the best way to showcase my data analytics project?
- GitHub (for code-based projects)
- Tableau Public (for dashboards)
- LinkedIn post (to explain findings)
- Kaggle notebook (for data storytelling)

 in Hyderabad by Brolly.Group