
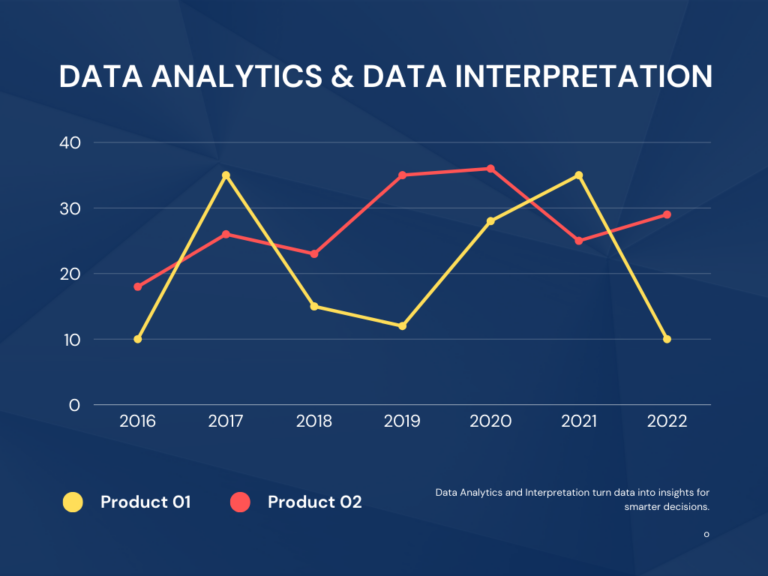
Data Analytics And Interpretation

- Data analytics and interpretation involve analyzing raw data to uncover insights and making sense of the results to support decision-making. While data analytics finds patterns and trends, interpretation ensures these insights are understood and applied effectively.
What is Data Analytics?
Data analytics is the process of examining raw data to find trends, patterns, and insights.
It uses statistical methods, algorithms, and technology to extract meaningful information.
Businesses use data analytics to make informed decisions and improve performance.
It includes techniques like descriptive, diagnostic, predictive, and prescriptive analytics.
Data analytics helps optimize operations, enhance customer experience, and drive innovation.
what is Data Interpretation?
Data interpretation is the process of analyzing and explaining the meaning of data.
It helps convert raw data into useful insights for decision-making.
Techniques like statistical analysis, visualization, and comparisons are used to interpret data.
Accurate interpretation ensures reliability and prevents misrepresentation of information.
It plays a crucial role in business, research, and problem-solving by providing actionable insights.
How Data Analytics and Data Interpretation Work?
Both processes follow a structured approach to turn raw information into meaningful insights:
1. Data Collection:
Data collection is the first and most important step in data analytics.
It involves gathering raw information from different sources to create a complete dataset.
The quality of collected data affects the accuracy of insights and decisions.
Companies collect data from sources like databases, surveys, social media, websites, and customer feedback.
Internal data, such as sales records and employee performance, helps businesses grow.
External data, like market trends and competitor analysis, supports strategic decisions.
Structured data (numbers, transactions) is collected through automated systems like ERP and CRM tools.
Unstructured data (reviews, social media posts) needs text mining and NLP techniques for analysis.
Good data collection ensures accurate and relevant information for better decision-making.
With technology, real-time data collection helps businesses quickly adapt to market and customer needs.
Data Cleaning
Data cleaning (also called data cleansing or scrubbing) is an important step in data analytics.
It ensures data is accurate, consistent, and reliable for better decision-making.
The process includes fixing errors, removing duplicates, and handling missing or inconsistent data.
Duplicate entries often come from multiple sources or repeated transactions and need to be removed.
Mistakes in data may happen due to human errors, system issues, or outdated information and must be corrected.
Missing values can be filled using predictions or removed if they affect the analysis.
Standardizing formats, like date styles, capitalization, and measurement units, keeps data uniform.
Detecting and removing outliers prevents extreme values from distorting results.
Clean data leads to better insights, more accurate forecasts, and improved business decisions.
High-quality data helps organizations work efficiently and avoid costly mistakes.
Data Processing
Data processing converts raw data into a structured and usable format for analysis.
Since raw data is often messy and inconsistent, it must be refined for accuracy and reliability.
This step makes data meaningful and ready for decision-making.
Processing includes cleaning, sorting, merging, and standardizing data from different sources.
Data may be categorized, filtered, or aggregated based on its relevance to the analysis.
Errors, duplicates, and unnecessary information are removed to improve accuracy.
Well-processed data helps organizations extract insights quickly and make better decisions.
It enhances analytical models, making predictions and trend analysis more reliable.
Industries like finance, healthcare, and marketing use processed data for risk assessment and customer analysis.
Advanced technology, automation, and machine learning have made data processing faster and more efficient.
Data Analysis
Data analysis is the process of examining and organizing data to find patterns, trends, and insights.
It uses statistical methods, machine learning, and AI to turn raw data into useful information.
Businesses, researchers, and analysts use data analysis to improve performance and make better decisions.
The process starts by choosing the right method based on the problem being analyzed.
Descriptive analysis looks at past trends, while predictive analysis forecasts future outcomes.
Machine learning and AI help find hidden patterns and make automated predictions.
Visualization tools like charts, graphs, and dashboards present findings in a clear way.
Data analysis improves efficiency, reduces risks, and supports informed decision-making.
Industries like healthcare, finance, and marketing use it for customer insights, fraud detection, and more.
With advancing technology, data analysis is becoming faster, more accurate, and essential for businesses.
Data Interpretation
Data interpretation means understanding and explaining the results of data analysis.
It helps identify trends, relationships, and patterns to support decision-making.
While data analysis finds insights, interpretation ensures they are correctly understood and applied.
Context is important—numbers and patterns only make sense when linked to the problem or goal.
For example, rising sales seem good, but understanding customer feedback and market trends gives deeper insights.
Interpretation includes summarizing key points, assessing their impact, and presenting findings clearly.
Visual tools like graphs, charts, and reports help explain data in a simple way.
Poor interpretation can lead to wrong conclusions and bad business decisions.
Industries use data interpretation to improve operations, customer service, and efficiency.
Accurate interpretation helps businesses make smart choices that drive growth and success
Data Visualization
Data visualization presents information using charts, graphs, tables, and reports to make complex data easy to understand.
It turns raw numbers into visual formats, helping businesses and individuals spot patterns and trends quickly.
Effective visuals make data analysis easier to interpret, bridging the gap between insights and decision-making.
Instead of reading large spreadsheets, people can use bar charts, pie graphs, line graphs, and heat maps to see key findings.
It is widely used in finance, healthcare, marketing, and business intelligence to track performance and trends.
Businesses use dashboards to monitor sales, customer behavior, and market changes in real time.
Healthcare professionals use visual reports to analyze patient records, disease outbreaks, and treatment success.
Without clear visualization, data can be difficult to interpret, reducing its usefulness.
Well-structured visuals improve understanding and help organizations act on insights quickly.
Combining strong data interpretation with clear visual representation maximizes the impact of data analytics.
Advantages of Data Analytics
1.Helps businesses make informed decisions
- Data analytics plays a crucial role in helping businesses make informed decisions by providing accurate insights based on real data.
- By analyzing trends, customer behavior, and market conditions, organizations can identify opportunities, reduce risks, and optimize strategies. Well-interpreted data allows businesses to improve efficiency, allocate resources effectively, and predict future outcomes.
- Whether in marketing, finance, or operations, data-driven decision-making leads to better performance, higher profitability, and a competitive edge.
- In today’s digital world, businesses that rely on data analytics can adapt quickly and stay ahead in a rapidly changing market.
2.Improves efficiency and reduces costs:
- Data analytics helps businesses streamline operations, improve productivity, and reduce unnecessary expenses.
- By analyzing workflows, resource allocation, and performance metrics, organizations can identify inefficiencies and implement cost-saving strategies. Predictive analytics helps in demand forecasting, preventing overproduction or inventory shortages.
- Automation of data-driven processes minimizes manual errors and optimizes resource utilization. Businesses can also identify and eliminate wasteful spending, leading to better financial management.
- By leveraging data insights, companies enhance overall efficiency, reduce operational costs, and improve profitability while maintaining high-quality performance in a competitive market.
3.Identifies market trends and customer preferences
- Data analytics helps businesses understand market trends and customer preferences by analyzing purchasing behavior, feedback, and industry patterns.
- By studying real-time and historical data, companies can anticipate demand, adjust marketing strategies, and develop products that align with customer needs.
- Social media insights, online reviews, and sales data provide valuable information on changing consumer interests. This enables businesses to stay competitive, attract the right audience, and improve customer satisfaction.
- By leveraging data-driven insights, organizations can adapt to market shifts and make informed decisions that drive long-term success.
4.Helps in detecting fraud and managing risks
- Data analytics plays a key role in detecting fraud and managing risks by identifying unusual patterns and inconsistencies in transactions.
- Businesses use advanced analytics, machine learning, and real-time monitoring to spot suspicious activities, such as unauthorized access, duplicate transactions, or financial anomalies.
- Predictive analytics helps in assessing potential risks and taking preventive measures before they escalate.
- Industries like banking, insurance, and cybersecurity rely on data-driven insights to prevent fraud, reduce financial losses, and enhance security. By proactively managing risks, organizations can protect assets, maintain trust, and ensure long-term stability.
Advantages of Data Interpretation
1.Makes complex information easier to understand
- Data analytics simplifies complex information by organizing raw data into structured, meaningful insights.
- Through techniques like data visualization, statistical analysis, and pattern recognition, businesses can present large datasets clearly and concisely.
- Graphs, charts, and dashboards make it easier to interpret trends, relationships, and key findings. This allows decision-makers to grasp important details quickly without getting lost in numbers.
- Whether in finance, healthcare, or marketing, data analytics transforms overwhelming information into actionable insights, enabling better communication and informed decision-making across all levels of an organization.
2.Ensures that decisions are based on correct insights
- Data analytics ensures that business decisions are backed by accurate and reliable insights rather than assumptions or guesswork.
- By collecting, processing, and analyzing data systematically, organizations can identify trends, patterns, and key performance indicators with precision.
- This reduces errors, minimizes risks, and enhances strategic planning. With data-driven decision-making, businesses can optimize operations, improve customer satisfaction, and achieve better outcomes.
- Whether in marketing, finance, or operations, relying on correct insights leads to more effective strategies, higher efficiency, and long-term success in a competitive market.
3.Improves communication of findings to teams and stakeholders
- Data analytics enhances communication by transforming complex data into clear, actionable insights that teams and stakeholders can easily understand.
- Through visual reports, dashboards, and presentations, key findings are presented in a structured and meaningful way.
- This helps businesses convey important trends, progress, and performance metrics effectively. With well-interpreted data, decision-makers can align strategies, improve collaboration, and ensure everyone is on the same page.
- Clear communication of insights leads to better coordination, faster decision-making, and improved overall efficiency within an organization.
4.Supports better planning and forecasting:
- Data analytics helps businesses make accurate predictions by analyzing past trends and current patterns.
- By using statistical models and machine learning algorithms, organizations can forecast demand, identify potential risks, and plan resources effectively.
- This enables better budgeting, inventory management, and strategic decision-making. Accurate forecasting helps businesses stay ahead of market changes, optimize operations, and reduce uncertainty.
- Whether in finance, supply chain, or marketing, data-driven planning ensures that companies are prepared for future challenges and opportunities, leading to improved efficiency and long-term growth.
Who Should Learn Data Analytics and Interpretation?
- Students and Job Seekers – Those looking to start a career in technology, business, or research.
- Professionals – IT workers, marketers, and business analysts who want to improve their skills.
- Business Owners – Entrepreneurs who want to use data for growth and better decision-making.
- Finance and Accounting Professionals – For financial analysis and fraud detection.
- Healthcare and Research Experts – To analyze medical data and improve services.
Current Trends in Data Analytics and Interpretation
1.Increasing demand for data experts across industries
- The demand for data experts is growing rapidly as businesses rely on data-driven strategies to stay competitive.
- Industries such as finance, healthcare, marketing, and e-commerce need skilled professionals to analyze large datasets, identify trends, and make informed decisions.
- With advancements in artificial intelligence and big data technologies, companies seek data analysts, data scientists, and business intelligence professionals to optimize operations and improve efficiency.
- As organizations continue to generate vast amounts of data, the need for experts who can extract meaningful insights is higher than ever, creating numerous career opportunities.
2.High salaries for data analysts, scientists, and business intelligence professionals
- Data professionals, including data analysts, data scientists, and business intelligence experts, are among the highest-paid in the job market.
- Due to the increasing reliance on data-driven decision-making, companies are willing to offer competitive salaries to attract skilled professionals.
- Industries like finance, healthcare, and technology highly value data expertise, leading to strong job security and career growth.
- As demand for data specialists continues to rise, salaries remain high, making data analytics a lucrative career choice for those with strong analytical and technical skills.
3.More businesses are using AI and automation for data analysis
- Businesses are increasingly adopting AI and automation to enhance data analysis and decision-making.
- These technologies help process large datasets quickly, identify patterns, and generate accurate insights with minimal human intervention.
- AI-powered tools improve efficiency by automating repetitive tasks, reducing errors, and enabling real-time data monitoring. Industries such as finance, healthcare, and e-commerce rely on AI-driven analytics to optimize operations and predict market trends.
- As businesses continue to generate vast amounts of data, AI, and automation are becoming essential for gaining a competitive edge and improving overall performance.
4.Companies are investing in big data tools to handle large amounts of information
- As data generation continues to grow, companies are investing in big data tools to efficiently process and analyze large volumes of information.
- These tools enable businesses to store, manage, and extract valuable insights from structured and unstructured data.
- Technologies like Hadoop, Spark, and cloud-based analytics platforms help organizations improve decision-making, optimize operations, and enhance customer experiences.
- By leveraging big data solutions, companies can identify trends, detect anomalies, and gain a competitive advantage. As data-driven strategies become essential, investment in advanced analytics tools is rapidly increasing across industries.
5.Employers prefer candidates who can interpret and present data
- In today’s data-driven world, employers seek candidates who can not only analyze data but also interpret and present it effectively.
- Businesses rely on professionals who can translate complex datasets into meaningful insights that drive decision-making.
- Strong data visualization and communication skills are essential for presenting findings in a clear and actionable manner.
- Candidates who can create reports, build dashboards, and explain data trends are highly valued across industries. As companies prioritize data-driven strategies, professionals with these skills have a competitive edge in the job market.
Skills Gained from Learning Data Analytics and Interpretation
1.Creating reports and dashboards using visualization tools like Tableau and Power BI
- Data visualization tools like Tableau and Power BI help professionals create interactive reports and dashboards that simplify complex data.
- These tools allow users to transform raw data into visually appealing charts, graphs, and tables, making it easier to identify patterns and trends.
- Businesses use these dashboards for real-time monitoring, performance tracking, and decision-making. With drag-and-drop features and automation, Tableau, and Power BI enable quick data analysis without extensive coding.
- As data visualization becomes essential, proficiency in these tools is a valuable skill for data analysts and business professionals.
2.Using programming languages like Python, R, and SQL for data analysis
- Programming languages like Python, R, and SQL are essential for data analysis, helping professionals process, analyze, and visualize data efficiently.
- Python is widely used for machine learning, automation, and statistical analysis, while R is preferred for advanced statistical modeling and data visualization.
- SQL plays a crucial role in managing and querying large databases to extract relevant insights.
- These languages enable businesses to handle complex datasets, perform predictive analysis, and make data-driven decisions. Mastering Python, R, and SQL is highly valuable for anyone pursuing a career in data analytics.
3.Understanding machine learning and AI for predictive analysis
- Machine learning and AI play a crucial role in predictive analysis by identifying patterns in data and making accurate forecasts.
- These technologies use algorithms to analyze historical data, detect trends, and predict future outcomes.
- Businesses leverage machine learning for customer behavior analysis, fraud detection, and demand forecasting.
- AI-driven models continuously improve over time, enhancing decision-making and automation. Understanding machine learning and AI is essential for data professionals, as it enables organizations to optimize operations, reduce risks, and gain a competitive advantage in a data-driven world.
4.Applying statistical methods to find patterns and trends in data
- Statistical methods help analyze data by identifying patterns, relationships, and trends that drive informed decision-making.
- Techniques such as regression analysis, hypothesis testing, and probability distributions allow businesses to uncover meaningful insights from large datasets.
- By applying statistics, organizations can predict future trends, measure performance, and detect anomalies.
- These methods are widely used in fields like finance, healthcare, and marketing to optimize strategies and improve efficiency.
- Mastering statistical analysis is essential for data professionals, as it enables accurate forecasting and data-driven problem-solving.
5.Developing problem-solving skills to analyze business challenges
- Problem-solving skills are essential in data analytics, helping professionals identify business challenges and develop effective solutions.
- By analyzing data, businesses can uncover inefficiencies, detect market trends, and optimize operations. Critical thinking and analytical reasoning enable data professionals to interpret complex information, find patterns, and suggest data-driven strategies.
- These skills are valuable in decision-making, risk management, and performance improvement across industries.
- Strong problem-solving abilities allow organizations to adapt to changing market conditions, improve efficiency, and achieve long-term success through informed decision-making.
6.Explaining data insights in a simple and meaningful way
- Communicating data insights is essential for making informed decisions. Complex data must be translated into simple, meaningful explanations that non-technical stakeholders can understand.
- This involves using clear language, visualizations, and real-world examples to highlight key trends and patterns.
- Effective data storytelling helps businesses act on insights, improve strategies, and solve problems efficiently. Whether through reports, dashboards, or presentations, presenting data in an accessible way ensures that valuable information leads to practical and impactful decisions across various industries.
Basic Requirements to Learn Data Analytics and Interpretation
1.Understanding of basic mathematics and statistics
- A strong foundation in mathematics and statistics is essential for data analysis.
- Key mathematical concepts like algebra, probability, and calculus help in pattern recognition and model building.
- Statistics provides tools such as mean, median, standard deviation, correlation, and regression for data insights.
- These techniques help businesses measure trends, forecast outcomes, and make informed decisions.
- Statistical knowledge ensures accuracy in data interpretation, reducing errors in analysis.
- Concepts like hypothesis testing, data sampling, and probability distributions validate findings.
- Mastering these fundamentals is crucial for careers in data analytics, machine learning, and AI.
2.Familiarity with Excel and databases is helpful but not required
- Experience with Excel and databases is helpful for data analysis but not mandatory.
- Excel offers tools like pivot tables, VLOOKUP, and statistical formulas for organizing and analyzing data.
- Businesses use Excel for handling structured data and performing quick calculations.
- Databases store large volumes of data, and SQL helps retrieve and manipulate information efficiently.
- Modern tools like Python and R provide advanced data processing without requiring Excel expertise.
- Beginners can start with simple tools and learn database management as needed.
- Strong analytical thinking and problem-solving skills matter more than specific software knowledge.
- Many data analysis tools can be learned over time based on industry requirements.
- Logical thinking and problem-solving skills are crucial for data analysis.
- Logical reasoning helps analysts break down complex problems and ensure accuracy in findings.
- Identifying patterns and making data-driven recommendations improves business decision-making.
- Problem-solving is essential for handling messy data, unexpected trends, and inconsistencies.
- Critical thinking helps clean, process, and interpret data for relevant and actionable insights.
- These skills are especially valuable in finance, healthcare, and marketing industries.
- Strong problem-solving abilities help optimize processes and drive better business outcomes.
- With continuous practice, data professionals become more efficient in handling complex tasks.
3.Coding experience is not necessary for beginners, but learning Python or SQL can be useful
- Beginners in data analytics do not need prior coding experience, as many tools like Excel, Power BI, and Tableau allow data analysis without programming.
- However, learning languages like Python or SQL can be highly beneficial for handling larger datasets and automating tasks.
- Python is widely used for statistical analysis, data visualization, and machine learning, while SQL helps in querying and managing databases efficiently.
- Knowing these languages enables analysts to work with structured and unstructured data, perform advanced analysis, and streamline repetitive tasks.
- Many online courses and beginner-friendly tutorials make learning Python and SQL accessible to anyone interested in data analytics.
- While coding is not mandatory at the start, gaining programming skills over time can open up more opportunities, improve efficiency, and enhance career growth in the field of data analytics.
Conclusion
- Data analytics and interpretation are essential for transforming raw data into meaningful insights that drive informed decisions.
- While analytics identifies trends and patterns, interpretation ensures their correct understanding and application.
- Together, they help businesses improve efficiency, optimize strategies, and achieve long-term success.

 in Hyderabad by Brolly.Group