
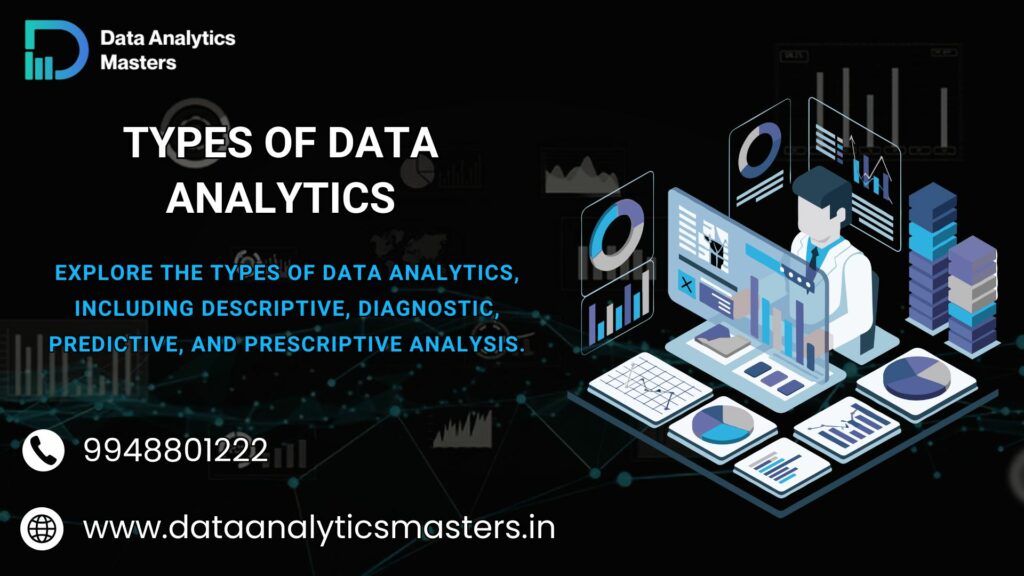
Types Of Data Analytics
Data analytics helps organizations understand patterns, identify opportunities, reduce risks, and improve overall performance. By using the right analytical approach, businesses can solve problems faster and make data-driven decisions with confidence.
There are four main types of data analytics: descriptive, diagnostic, predictive, and prescriptive analytics. Each type answers a different business question, from understanding what happened in the past to recommending the best actions for the future. In this guide, you’ll learn how each type works, where it is used, and why it matters in modern business.
What is Data Analytics?

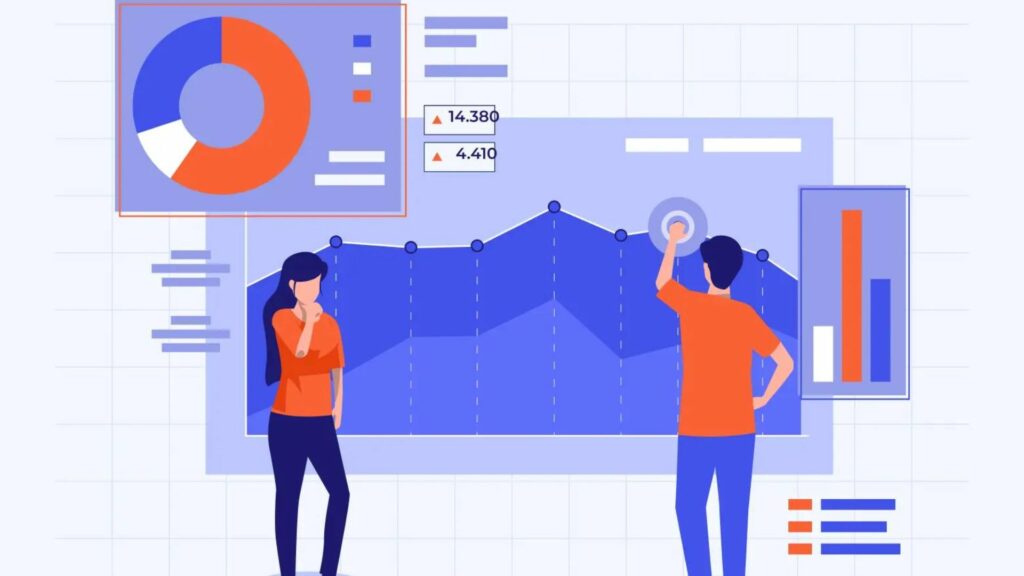
Data analytics is the process of collecting, organizing, cleaning, and analyzing data to discover useful patterns, trends, and insights. It helps businesses convert large amounts of raw information into meaningful knowledge that supports better decisions. In today’s digital economy, organizations rely on data analytics to understand customer behavior, improve operations, reduce risks, and identify new growth opportunities.
What Does Data Analytics Mean?
In simple terms, data analytics means examining data to answer important business questions such as:
- What happened in the business last month?
- Why did sales increase or decrease?
- What trends are likely to happen in the future?
- What actions should be taken to improve performance?
Data analytics combines data, technology, statistical methods, and business knowledge to generate actionable insights.
Definition of Data Analytics
“The systematic process of inspecting, transforming, and interpreting data to extract meaningful insights, solve problems, and support decision-making.”
Core activities involved in data analytics:
- Data Collection
Gathering data from different sources such as websites, applications, customer records, sales systems, surveys, and social media. - Data Cleaning
Removing duplicate, incomplete, or incorrect information to improve accuracy. - Data Processing
Organizing and structuring data into a usable format. - Data Analysis
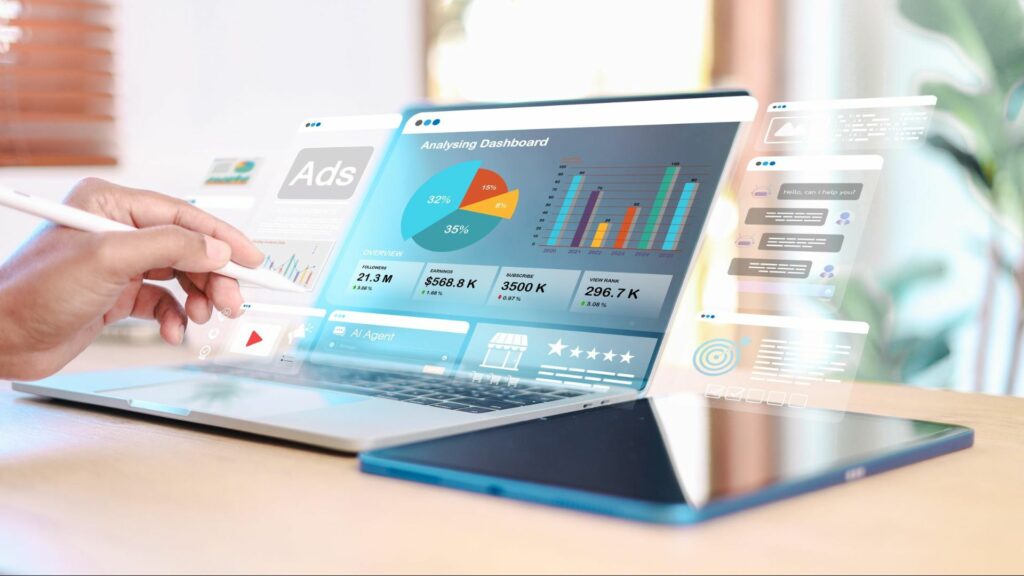
Identifying patterns, trends, relationships, and anomalies. - Data Visualization
Presenting insights using charts, graphs, dashboards, and reports.
Difference Between Raw Data and Actionable Insights
Understanding this difference is essential in data analytics.
Raw Data | Actionable Insights |
Unprocessed information | Meaningful interpretation of data |
Difficult to understand | Easy to use for decisions |
Contains numbers, text, records | Provides recommendations or conclusions |
No direct business value | Helps improve performance |
Example:
Suppose an online store records:
- 50,000 website visitors
- 1,200 product purchases
- 700 abandoned carts
This is raw data.
After analysis, the business discovers:
- Most customers leave during checkout because delivery charges are high.
This becomes an actionable insight, because the company can now improve conversions by adjusting shipping policies.
Role of Analytics in Modern Business
In modern organizations, data analytics plays a major role in almost every department.
1. Marketing Optimization
Businesses use analytics to:
- Track campaign performance
- Measure customer engagement
- Identify high-performing channels
- Improve return on investment (ROI)
2. Sales Performance Improvement
Analytics helps sales teams:
- Track revenue trends
- Identify best-selling products
- Forecast future sales
3. Customer Experience Enhancement
Companies analyze customer behavior to:
- Understand preferences
- Improve personalization
- Increase customer retention
4. Operational Efficiency
Organizations use analytics to:
- Reduce waste
- Improve productivity
- Optimize workflows
5. Risk Management
Analytics helps detect:
- Fraud patterns
- Security risks
- Financial irregularities
6. Strategic Decision-Making
Leadership teams use analytics for:
- Business expansion decisions
- Market research
- Product development planning
Today, companies across healthcare, finance, retail, education, and manufacturing use data analytics to stay competitive and make smarter decisions faster.
Why is Data Analytics Important in 2026?
In 2026, data analytics will become one of the most valuable business capabilities. Organizations across industries generate massive amounts of data every day through websites, mobile apps, customer interactions, IoT devices, digital transactions, and internal systems. The companies that can analyze this data effectively gain a major advantage in the market. Data analytics is no longer optional—it has become essential for growth, innovation, and long-term business success.
1. Digital Transformation
Most businesses are rapidly moving toward digital platforms. Whether it is e-commerce, healthcare, banking, education, or manufacturing, companies now depend on digital tools and cloud-based systems to run their operations.
Data analytics supports digital transformation by helping businesses:
- Collect data from multiple digital channels
- Track customer interactions in real time
- Measure digital performance metrics
- Identify gaps in business processes
- Improve user experience across platforms
Example:
An e-commerce company can analyze website visitor behavior to understand which products customers view the most and which pages lead to higher conversions.
2. AI-Driven Decision Making
artificial intelligence will be deeply integrated into business operations. AI systems depend on high-quality data to generate predictions, automate tasks, and recommend actions.
Data analytics supports AI by:
- Preparing clean and structured data
- Training machine learning models
- Identifying patterns in large datasets
- Improving prediction accuracy
- Supporting intelligent automation
Example:
A financial company can use AI and analytics to detect fraudulent transactions instantly based on unusual spending behavior.
3. Competitive Advantage
Modern businesses compete not only on products or pricing but also on how effectively they use data.
Organizations that use data analytics can:
- Understand market trends early
- Predict customer demands
- Launch products faster
- Optimize marketing campaigns
- Make faster strategic decisions
Example:
A retail business can identify seasonal buying trends and stock inventory before competitors.
4. Operational Efficiency
Businesses constantly look for ways to reduce costs, save time, and improve productivity. Data analytics helps identify inefficiencies in operations.
Analytics improves operational efficiency by:
- Monitoring workflow performance
- Reducing unnecessary expenses
- Identifying process bottlenecks
- Improving supply chain management
- Optimizing workforce productivity
Example:
A manufacturing company can use analytics to predict machine failures before they happen, reducing downtime.
Key Benefits of Data Analytics
1. Better Business Intelligence
Data analytics helps businesses convert raw data into meaningful insights. Decision-makers can access dashboards, reports, and performance metrics to understand business performance clearly.
Benefits include:
- Real-time reporting
- Performance tracking
- KPI monitoring
- Strategic planning support
Business intelligence helps leaders make informed decisions instead of assumptions.
2. Faster Decision-Making
With real-time analytics tools, businesses no longer need to wait weeks for reports.
Analytics enables:
- Quick access to important metrics
- Faster response to market changes
- Immediate issue detection
- Agile business decisions
Example:
A marketing team can instantly pause underperforming ad campaigns and shift budget to high-performing campaigns.
3. Risk Mitigation
Every business faces risks such as fraud, market fluctuations, customer churn, and operational failures.
Data analytics helps reduce risks by:
- Detecting unusual patterns
- Predicting potential failures
- Identifying financial anomalies
- Monitoring security threats
Example:
Banks use analytics to flag suspicious transactions in real time.
4. Customer Behavior Analysis
Understanding customer behavior is one of the biggest advantages of analytics.
Businesses can analyze:
- Purchase patterns
- Browsing behavior
- Product preferences
- Customer feedback
- Engagement trends
Example:
Streaming platforms use analytics to recommend personalized content based on user behavior.
5. Revenue Optimization
Data analytics helps businesses identify opportunities to increase revenue and profitability.
Analytics supports revenue growth through:
- Pricing optimization
- Customer segmentation
- Sales forecasting
- Product performance analysis
- Marketing ROI improvement
Example:
An online business can discover which products generate the highest profit and focus promotions on them.
The 4 Types of Data Analytics Explained
1. Descriptive Analytics – Understanding What Happened
Descriptive analytics is the foundation of data analytics. It focuses on analyzing historical data to understand what has already happened in a business, process, campaign, or system. It converts raw data into meaningful summaries, helping organizations identify patterns, trends, and performance metrics.
Descriptive analytics is usually the first step in the analytics journey because before solving a problem or predicting the future, businesses must first understand past performance.
It answers questions such as:
- What were our total sales last month?
- How many customers visited our website?
- Which product performed best?
- How did our marketing campaign perform?
- What was our customer retention rate?
By answering these questions, businesses gain visibility into performance and can make informed decisions.
What is Descriptive Analytics?
Descriptive analytics is the process of collecting, organizing, and summarizing historical data to identify what happened over a specific period.
It helps businesses transform large datasets into understandable information through:
- Reports
- Dashboards
- Charts
- Graphs
- Performance summaries
The goal is to present historical performance clearly so decision-makers can understand business outcomes.
For example, if a company wants to know how many products were sold during the last quarter, descriptive analytics provides that information using historical sales data.
How Does Descriptive Analytics Work?
Descriptive analytics follows a structured process to transform raw business data into useful insights.
Step 1: Data Collection
Businesses collect data from multiple sources such as:
- Sales systems
- Customer databases
- Websites
- Mobile applications
- Social media platforms
- CRM tools
For example, an e-commerce company may collect:
- Number of orders
- Revenue data
- Customer visits
- Product views
Step 2: Data Cleaning
Collected data often contains errors, duplicate entries, or missing values. Data cleaning ensures the information is accurate and reliable.
This process includes:
- Removing duplicate records
- Correcting incorrect values
- Handling missing data
- Standardizing formats
Step 3: Data Organization
After cleaning, data is structured into categories for analysis.
Examples include:
- Daily sales data
- Monthly customer visits
- Regional revenue reports
- Product performance metrics
Step 4: Data Analysis and Visualization
The data is then summarized using visual and reporting methods that help decision-makers understand trends easily.
Common Methods Used in Descriptive Analytics
1. Reporting
Reporting is one of the most common descriptive analytics methods. It summarizes business performance over a specific period.
Reports may include:
- Daily sales reports
- Monthly revenue reports
- Marketing campaign reports
- Customer acquisition reports
Example:
A company creates a monthly report showing:
- Total revenue
- Number of new customers
- Best-selling products
This helps management evaluate performance.
2. KPI Dashboards
KPI (Key Performance Indicator) dashboards display important business metrics in real time.
Common KPIs include:
- Revenue growth
- Conversion rate
- Customer retention rate
- Website traffic
- Customer satisfaction score
KPI dashboards allow teams to monitor business health quickly.
3. Data Aggregation
Data aggregation combines information from multiple sources into a single summary.
For example:
A retail business combines data from:
- Physical stores
- Online sales
- Mobile app purchases
This provides a complete business overview.
4. Trend Analysis
Trend analysis identifies patterns over time.
Businesses use it to understand:
- Sales growth trends
- Seasonal demand patterns
- Customer behavior changes
- Traffic fluctuations
Example:
A company notices sales increase every festive season, helping them plan inventory better.
What Tools Are Used in Descriptive Analytics?
Businesses use various tools to collect, analyze, and visualize descriptive data.
Popular tools include:
- Microsoft Power BI – Used for interactive dashboards and reports
- Tableau – Used for charts, dashboards, and business insights
- Google Analytics – Used for website traffic and user behavior analysis
- Microsoft Excel – Used for data reporting, charts, and calculations
These tools help businesses turn raw data into understandable visual insights.
Real Business Examples of Descriptive Analytics
1. Monthly Sales Reports
A retail company analyzes monthly sales data to understand:
- Total revenue generated
- Best-selling products
- Low-performing categories
- Regional sales performance
This helps improve future sales planning.
2. Website Traffic Analysis
An online business uses website analytics to track:
- Total visitors
- Traffic sources
- Bounce rate
- Most visited pages
- Conversion rate
This helps improve website performance and user experience.
3. Customer Engagement Reports
A marketing team analyzes customer engagement data such as:
- Email open rates
- Social media interactions
- Ad click-through rates
- Website session duration
This helps optimize future marketing campaigns.
2. Diagnostic Analytics – Finding the Root Cause
Diagnostic analytics helps businesses understand why something happened. After descriptive analytics identifies a trend, performance change, or business problem, diagnostic analytics investigates the underlying causes. It goes deeper into the data to uncover relationships, patterns, anomalies, and hidden factors that affect business outcomes.
This type of analytics is essential for solving problems, improving decision-making, and preventing similar issues in the future.
Diagnostic analytics answers questions such as:
- Why did sales decrease this month?
- Why did website traffic suddenly drop?
- Why are customers leaving the platform?
- Why did operational costs increase?
- Why did campaign performance decline?
Instead of only showing the results, diagnostic analytics helps organizations discover the reasons behind those results.
What is Diagnostic Analytics?
Diagnostic analytics is the process of examining historical data to identify the root causes behind business outcomes, trends, or unexpected changes.
It helps businesses move beyond “what happened” and focus on “why it happened.”
- Comparing multiple data sources
- Identifying relationships between variables
- Finding unusual patterns or anomalies
- Investigating performance changes over time
For example, if a company notices a drop in revenue, diagnostic analytics helps identify whether the issue is related to pricing, customer behavior, product quality, competition, or marketing performance.
How Does Diagnostic Analytics Work?
Diagnostic analytics follows a step-by-step investigation process.
Step 1: Identify the Problem
The first step is identifying a business issue discovered through descriptive analytics.
Examples:
- Sales dropped by 20%
- Website traffic declined
- Customer complaints increased
- Subscription cancellations went up
This creates the starting point for investigation.
Step 2: Gather Relevant Data
Businesses collect data related to the issue from different systems such as:
- Sales databases
- Customer feedback systems
- Marketing platforms
- Website analytics tools
- CRM systems
The goal is to gather all possible factors connected to the problem.
Step 3: Analyze Relationships and Patterns
Analysts then examine the data using diagnostic techniques to identify possible causes.
This may include:
- Comparing time periods
- Segmenting customer groups
- Identifying behavioral changes
- Finding unusual patterns
Step 4: Identify the Root Cause
After analyzing the data, businesses identify the main factor or combination of factors causing the issue.
This helps teams take corrective actions based on facts rather than assumptions.
Common Techniques Used in Diagnostic Analytics
1. Drill-Down Analysis
Drill-down analysis breaks summarized data into smaller details to identify where problems exist.
Businesses can analyze data by:
- Region
- Product category
- Customer segment
- Marketing channel
- Time period
Example:
A company sees an overall drop in sales.
After drilling down, they discover:
- Sales are stable in most regions
- Sales dropped only in one specific city
2. Correlation Analysis
Correlation analysis helps identify relationships between two or more variables.
It answers questions like:
- Does higher ad spending increase sales?
- Does slower website speed reduce conversions?
- Does customer satisfaction affect retention?
Example:
A business finds that as website loading time increases, cart abandonment also increases.
3. Root Cause Analysis
Root cause analysis identifies the primary reason behind a problem.
It focuses on finding the main issue instead of only treating symptoms.
Example:
A manufacturing company notices delayed deliveries.
After analysis, they discover:
- Supplier delays caused raw material shortages
4. Cohort Analysis
Cohort analysis groups users or customers based on shared behaviors or characteristics.
Businesses may group customers based on:
- Signup date
- Purchase behavior
- Location
- Product usage
Example:
A subscription platform finds that users who joined during a discount campaign cancel more frequently than regular customers.
What Tools Are Used in Diagnostic Analytics?
Businesses use specialized tools to investigate data and discover hidden insights.
Popular tools include:
- SQL Server – Used for querying and analyzing structured business data
- Python – Used for statistical analysis, automation, and advanced data investigation
- R – Used for statistical modeling and data exploration
Real Business Examples of Diagnostic Analytics
1. Why Did Sales Drop?
A retail company notices that monthly sales decreased by 18%.
Using diagnostic analytics, the company investigates:
- Website traffic sources
- Product pricing changes
- Customer reviews
- Competitor promotions
After analysis, they discover:
- Mobile users experienced checkout issues
- Cart abandonment increased significantly
Root cause identified: Poor mobile checkout experience.
Business action:
- Optimize mobile checkout process
- Improve page loading speed
2. Why Did Customer Churn Increase?
A subscription-based company notices that customer cancellations have increased.
Using diagnostic analytics, they analyze:
- Customer support interactions
- Product usage behavior
- Login frequency
- Feedback ratings
After investigation, they discover:
- Customers who did not complete onboarding were more likely to cancel
Root cause identified: Poor onboarding experience.
Business action:
- Improve onboarding tutorials
- Send engagement reminders
- Provide personalized support
3. Predictive Analytics – Forecasting Future Outcomes
Predictive analytics helps businesses understand what is likely to happen in the future by analyzing historical data, identifying patterns, and using advanced statistical models. Instead of only looking at past performance, predictive analytics helps organizations forecast trends, reduce uncertainty, and prepare for future opportunities or risks.
In 2026, predictive analytics has become a critical business capability because organizations want to make proactive decisions instead of reacting after problems occur.
Predictive analytics answers important business questions such as:
- What will next month’s sales look like?
- Which customers are likely to stop buying?
- Will demand increase during the next season?
- Which transactions may be fraudulent?
- What business risks may appear in the future?
By using predictive analytics, companies can improve planning, reduce losses, and make smarter strategic decisions.
What is Predictive Analytics?
Predictive analytics is the process of using historical data, statistical algorithms, machine learning models, and pattern recognition techniques to forecast future outcomes.
It helps businesses estimate probabilities and identify what may happen next based on past trends and current behavior.
Predictive analytics is widely used in:
- Sales forecasting
- Customer behavior analysis
- Risk management
- Fraud detection
- Demand planning
- Marketing optimization
For example, an e-commerce company can analyze previous customer purchases and predict which customers are most likely to buy again.
How Does Predictive Analytics Work?
Step 1: Collect Historical Data
The first step is gathering past business data from multiple sources such as:
- Customer transactions
- Sales databases
- Marketing campaigns
- Website activity
- Financial records
- Product performance data
Example data may include:
- Monthly revenue
- Customer purchase history
- Product demand trends
- Website conversion rates
Step 2: Clean and Prepare Data
Raw data often contains:
- Missing values
- Duplicate records
- Incorrect entries
- Inconsistent formats
Data cleaning improves model accuracy and ensures reliable predictions.
Step 3: Identify Patterns
Analysts use algorithms and statistical methods to find hidden relationships in the data.
Examples:
- Seasonal buying trends
- Customer purchase cycles
- Spending behavior patterns
- Fraud indicators
Step 4: Build Predictive Models
Machine learning or statistical models are trained using historical data.
These models learn from past patterns and generate future forecasts.
Step 5: Generate Predictions
Once the model is trained, businesses can predict:
- Future sales
- Customer churn probability
- Inventory demand
- Fraud risk
- Market trends
This helps organizations take proactive actions.
Common Techniques Used in Predictive Analytics
1. Machine Learning
Machine learning allows systems to learn patterns from historical data and improve predictions automatically over time.
It is used for:
- Customer behavior prediction
- Fraud detection
- Product recommendations
- Marketing personalization
Example:
An online platform predicts which products customers are most likely to buy based on browsing behavior.
2. Regression Models
Regression analysis identifies relationships between variables and predicts numerical outcomes.
It is commonly used for:
- Sales forecasting
- Revenue prediction
- Price optimization
- Budget planning
Example:
A business predicts monthly sales based on advertising spend and customer traffic.
3. Time Series Forecasting
Time series forecasting analyzes data collected over time to predict future trends.
It is used for:
- Seasonal demand forecasting
- Stock market analysis
- Revenue projections
- Inventory planning
Example:
A retail company predicts festive season product demand based on previous years’ sales.
4. Classification Models
Classification models group data into categories based on probability.
They are used for:
- Fraud detection
- Customer churn prediction
- Loan approval decisions
- Risk classification
Example:
A bank predicts whether a transaction is genuine or potentially fraudulent.
What Tools Are Used in Predictive Analytics?
Businesses use advanced tools and frameworks to build predictive models.
Popular tools include:
- Python – Widely used for machine learning, predictive modeling, and automation
- Apache Spark – Used for big data processing and predictive analytics at scale
- TensorFlow – Used for building deep learning and predictive models
These tools help data scientists process large datasets and create accurate forecasting models.
Real Business Examples of Predictive Analytics
1. Demand Forecasting
Retail and manufacturing companies use predictive analytics to estimate future product demand.
They analyze:
- Historical sales data
- Seasonal trends
- Customer purchasing patterns
- Market demand
Example:
A supermarket predicts increased demand for beverages during summer and increases inventory in advance.
Business benefit:
- Reduced stock shortages
- Better inventory planning
- Higher sales opportunities
2. Fraud Detection
Banks, insurance companies, and fintech platforms use predictive analytics to detect suspicious activities.
The system analyzes:
- Transaction history
- Spending behavior
- Login patterns
- Geographic activity
Example:
If a customer usually spends locally but suddenly makes large international transactions, the system flags it as potential fraud.
Business benefit:
- Reduced financial losses
- Improved security
- Better customer trust
3. Customer Churn Prediction
Subscription businesses and service providers use predictive analytics to identify customers likely to leave.
The system analyzes:
- Login frequency
- Purchase history
- Support tickets
- Usage behavior
Example:
A streaming platform identifies users who have not watched content for several weeks and predicts a high churn risk.
Business action:
- Send personalized offers
- Offer discounts
- Launch engagement campaigns
Business benefit:
- Higher customer retention
- Increased lifetime value
- Reduced churn rate
4. Prescriptive Analytics – Recommending the Best Action
Prescriptive analytics is the most advanced type of data analytics. It helps businesses decide what action should be taken next based on insights generated from descriptive, diagnostic, and predictive analytics. Instead of only understanding past performance or forecasting future outcomes, prescriptive analytics provides intelligent recommendations that support better decision-making.
In 2026, businesses use prescriptive analytics to automate decisions, optimize resources, reduce risks, and improve operational efficiency. It combines data analysis, business rules, artificial intelligence, machine learning, and optimization techniques to recommend the best possible action.
Prescriptive analytics answers important business questions such as:
- What pricing strategy should we use?
- Which customers should receive special offers?
- How can we reduce delivery costs?
- What inventory levels should we maintain?
- How can we maximize profit while reducing risk?
By using prescriptive analytics, organizations can make smarter, faster, and more profitable decisions.
What is Prescriptive Analytics?
Prescriptive analytics is the process of analyzing data, predicting possible outcomes, and recommending the best course of action to achieve a specific business goal.
It not only predicts what may happen but also suggests:
- What action to take
- When to take action
- Which strategy will produce the best results
- How to minimize risks and costs
For example, if a retailer predicts high demand for a product, prescriptive analytics may recommend increasing stock levels, adjusting pricing, or launching promotional campaigns.
How Does Prescriptive Analytics Work?
Step 1: Collect and Analyze Business Data
The system gathers data from various sources such as:
- Sales records
- Customer behavior data
- Inventory systems
- Supply chain data
- Financial systems
- Market trends
This creates the foundation for analysis.
Step 2: Use Predictive Insights
Prescriptive analytics often works after predictive analytics.
For example, predictive analytics may show:
- Demand for a product will increase by 25% next month
Prescriptive analytics then decides:
- How much inventory to order
- When to restock
- Which suppliers to use
Step 3: Evaluate Multiple Scenarios
The system tests different business scenarios to identify the best possible outcome.
Examples:
- What happens if prices increase by 5%?
- What happens if the marketing budget is reduced?
- What happens if delivery routes change?
Step 4: Recommend the Best Action
Based on business goals, risks, and constraints, the system recommends the most effective action.
Common Techniques Used in Prescriptive Analytics
1. Optimization Models
Optimization models help businesses find the best possible solution among multiple options.
They are used for:
- Cost reduction
- Profit maximization
- Resource allocation
- Production planning
Example:
A manufacturing company optimizes machine schedules to maximize output while reducing energy costs.
2. Simulation Models
Simulation models test multiple possible scenarios before implementing real-world decisions.
They help businesses:
- Analyze risks
- Test strategies
- Prepare for uncertainty
Example:
An airline may simulate fuel price changes to understand how operating costs could be affected.
3. Decision Trees
Decision trees help businesses choose the best action by mapping possible outcomes and risks.
They are commonly used for:
- Loan approvals
- Customer targeting
- Risk assessment
- Investment decisions
Example:
A bank may use decision trees to determine whether to approve a loan application.
4. Reinforcement Learning
Reinforcement learning allows AI systems to learn through experience and continuously improve decisions over time.
It is used in:
- Automated pricing
- Personalized recommendations
- Robotics
- Smart logistics
Example:
An online platform continuously adjusts product recommendations based on customer interactions.
What Tools Are Used in Prescriptive Analytics?
Businesses use advanced analytics tools to build optimization models and decision systems.
Popular tools include:
- IBM SPSS – Used for predictive modeling, optimization, and advanced analytics
- SAS – Used for decision-making, forecasting, and business optimization
These tools help organizations build intelligent recommendation systems and optimize business strategies.
Real Business Examples of Prescriptive Analytics
1. Dynamic Pricing
Retailers, airlines, hotels, and e-commerce companies use prescriptive analytics to adjust prices in real time based on demand, competition, and customer behavior.
The system analyzes:
- Customer demand
- Competitor pricing
- Seasonal trends
- Inventory availability
Example:
An airline increases ticket prices when demand rises during holidays.
Business benefit:
- Increased revenue
- Better profit margins
- Real-time pricing decisions
2. Inventory Optimization
Businesses use prescriptive analytics to maintain the right inventory levels without overstocking or stock shortages.
The system analyzes:
- Demand forecasts
- Supplier performance
- Storage costs
- Seasonal sales patterns
Example:
A supermarket automatically increases the stock of cold beverages during summer.
Business benefit:
- Reduced storage costs
- Lower stockouts
- Better customer satisfaction
3. Route Optimization
Logistics and delivery companies use prescriptive analytics to find the most efficient delivery routes.
The system analyzes:
- Traffic conditions
- Delivery locations
- Fuel costs
- Vehicle capacity
Example:
A delivery company chooses the fastest route based on live traffic data.
Business benefit:
- Reduced fuel costs
- Faster deliveries
- Improved operational efficiency
Comparison of the 4 Types of Data Analytics
Understanding the differences between the four types of data analytics helps businesses choose the right analytical approach for specific goals. Each type answers a different business question and plays a unique role in decision-making. While descriptive analytics helps organizations understand past performance, diagnostic analytics identifies the reasons behind outcomes. Predictive analytics forecasts future possibilities, and prescriptive analytics recommends the best actions to achieve business objectives.
Type | Main Question Answered | Primary Focus | Business Value |
Descriptive Analytics | What happened? | Historical data analysis | Tracks business performance and identifies trends |
Diagnostic Analytics | Why did it happen? | Root cause analysis | Helps solve problems and identify performance issues |
Predictive Analytics | What may happen next? | Future forecasting | Reduces uncertainty and helps businesses prepare for risks and opportunities |
Prescriptive Analytics | What should we do? | Decision optimization | Recommends the best actions for strategic business success |
Who Uses Different Types of Data Analytics?
Industry | How Data Analytics Is Used |
Healthcare | Patient outcome analysis, disease diagnostics, treatment optimization |
Finance | Fraud detection, credit risk analysis, investment forecasting |
Retail | Customer behavior analysis, inventory forecasting, sales optimization |
Marketing | Campaign performance analysis, customer segmentation, attribution modeling |
Manufacturing | Quality control, predictive maintenance, production optimization |
Education | Student performance tracking, learning behavior analysis, academic improvement |
Common Mistakes to Avoid in Data Analytics
Many businesses invest in data analytics but fail to achieve expected results because of avoidable mistakes. Understanding these common challenges helps organizations build more accurate, reliable, and business-focused analytics strategies.
1. Poor Data Quality
One of the biggest problems in data analytics is using inaccurate, incomplete, or duplicate data. If the input data is incorrect, the insights generated will also be unreliable.
Common data quality issues include:
- Missing values
- Duplicate records
- Incorrect entries
- Outdated information
- Inconsistent formats
Business Impact:
Poor data quality can lead to wrong forecasts, poor decisions, and financial losses.
2. Lack of Business Objectives
Many companies start analyzing data without clearly defining what problem they want to solve.
Examples:
- Increasing sales
- Reducing customer churn
- Improving operational efficiency
- Optimizing marketing campaigns
Without clear objectives, analytics may generate reports but fail to create business value.
Business Impact:
Teams may waste time analyzing irrelevant data without meaningful outcomes.
3. Overreliance on Tools
Analytics tools are powerful, but tools alone cannot solve business problems. Some organizations depend too much on software without understanding business context or data interpretation.
Common mistake:
- Trusting dashboards without deeper analysis
- Relying on automation without validation
- Ignoring human expertise
Business Impact:
This can result in misleading conclusions and poor strategic decisions.
4. Choosing the Wrong Analytics Model
Using the wrong analytical method can produce inaccurate insights.
Examples:
- Using predictive analytics when only descriptive analysis is needed
- Selecting the wrong machine learning model
- Applying incorrect statistical techniques
Business Impact:
Poor model selection can reduce accuracy and lead to bad business decisions.
5. Ignoring Data Governance
Data governance ensures that data is secure, accurate, consistent, and properly managed.
Ignoring governance can create issues such as:
- Data security risks
- Privacy violations
- Compliance problems
- Inconsistent reporting
Business Impact:
Poor governance can damage customer trust and create legal or operational risks.
Future of Data Analytics in 2026
The future of data analytics in 2026 is being shaped by artificial intelligence, automation, cloud computing, and real-time data processing. Businesses are no longer using analytics only to understand past performance—they now use advanced analytics to predict trends, automate decisions, and create smarter business strategies. As data volumes continue to grow, organizations need faster, more intelligent, and more scalable analytics systems to stay competitive.
1. Generative AI in Analytics
Generative AI is changing how businesses interact with data. Instead of manually creating reports or dashboards, users can ask questions in natural language and receive instant insights.
Generative AI helps businesses:
- Generate automated reports
- Summarize complex datasets
- Identify hidden patterns
- Create visual dashboards faster
- Support non-technical users in data analysis
Example:
A marketing manager can ask, “Which campaign generated the highest ROI last quarter?” and AI can instantly generate the answer with visual insights.
Business impact:
- Faster reporting
- Better accessibility
- Improved decision-making
2. Automated Insights
In 2026, analytics platforms are becoming smarter by automatically identifying important trends, anomalies, and opportunities without human intervention.
Automated analytics can:
- Detect sudden sales drops
- Identify unusual customer behavior
- Highlight performance changes
- Recommend optimization opportunities
Example:
A retail business receives an automatic alert that one product category is experiencing an unexpected increase in demand.
Business impact:
- Faster response time
- Reduced manual analysis
- Improved operational efficiency
3. Real-Time Analytics
Businesses increasingly need immediate insights instead of waiting for daily or weekly reports. Real-time analytics processes live data as it is generated.
Real-time analytics is used in:
- Financial transactions
- Website monitoring
- Customer behavior tracking
- Logistics management
- Cybersecurity systems
Example:
An e-commerce platform monitors live customer activity and instantly detects checkout issues affecting conversions.
Business impact:
- Immediate problem detection
- Faster business decisions
- Better customer experience
4. Edge Analytics
Edge analytics processes data closer to where it is generated, such as IoT devices, sensors, machines, or mobile devices, instead of sending everything to the cloud.
Edge analytics helps businesses:
- Reduce latency
- Process data faster
- Improve device performance
- Support remote operations
Example:
A manufacturing machine detects equipment failure in real time before sending alerts to the central system.
Business impact:
- Faster decision-making
- Reduced downtime
- Improved operational reliability
5. Cognitive Analytics
Cognitive analytics combines artificial intelligence, machine learning, and human-like reasoning to understand complex business situations.
Cognitive analytics can:
- Understand customer sentiment
- Analyze text, voice, and images
- Learn from previous decisions
- Recommend personalized business strategies
Example:
A customer support system analyzes customer conversations and predicts satisfaction levels automatically.
Business impact:
- Smarter decision-making
- Better customer personalization
- Advanced business intelligence
FAQs
1. What is the difference between data analysis and data analytics?
Data analysis focuses on examining data for insights, while data analytics includes collecting, processing, analyzing, and interpreting data to support better business decisions.
2. Which type of data analytics should beginners start with?
Beginners should start with descriptive analytics because it helps understand historical data, reports, trends, and business performance before learning advanced analytics techniques.
3. Do I need coding skills to learn analytics?
Coding is not required in the beginning. Tools like Microsoft Excel and Microsoft Power BI help beginners start, while SQL and Python become useful later.
4. Can AI automate analytics workflows?
Yes, AI can automate data cleaning, pattern recognition, forecasting, and reporting, helping organizations save time and make faster, data-driven decisions.
5. Can multiple analytics types be used in one project?
Yes, businesses often combine descriptive, diagnostic, predictive, and prescriptive analytics in one project for complete insights and better decision-making.
6. What industries use analytics the most?
Industries like healthcare, finance, retail, marketing, manufacturing, and education heavily use analytics to improve performance, reduce risks, and optimize operations.
7. Which analytics tools are best for beginners?
Beginner-friendly tools include Microsoft Excel, Tableau, Microsoft Power BI, and Google Analytics for learning analytics concepts.
8. How can I start a career in data analytics?
Learn Excel, SQL, statistics, and visualization tools. Build projects, create a portfolio, earn certifications, and apply for entry-level analyst positions.
9. What is the biggest challenge in data analytics?
Poor data quality is one of the biggest challenges. Inaccurate, incomplete, or inconsistent data can affect analysis results and business decisions.
10. How does predictive analytics help businesses?
Predictive analytics helps businesses forecast customer behavior, market trends, risks, and future opportunities using historical data and statistical models.

 in Hyderabad by Brolly.Group