
Data Analytics Roadmap
Data Analytics Roadmap Overview
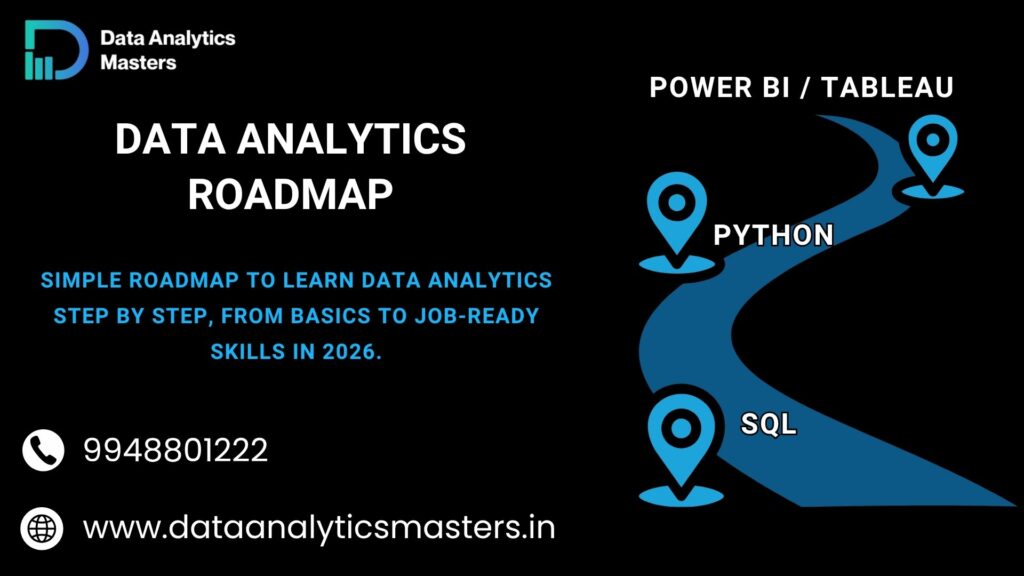
A Data Analytics Roadmap is a clear step-by-step guide that shows the skills, tools, and knowledge needed to build a career in data analytics. It helps beginners and professionals understand how to move from basic concepts to advanced topics in a simple and structured way.
In today’s data-driven world, the ability to analyze data is important for solving problems and making better decisions. Without a proper plan, learning data analytics can feel confusing. A roadmap makes this easier by breaking the journey into small, manageable steps.
It usually starts with understanding data basics, then moves to data collection, cleaning, analysis, and visualization. It also includes tools like Excel, SQL, Python, and Power BI, which are widely used in real jobs.
Whether you are a student, job seeker, or working professional, following a proper roadmap helps you focus on the right skills and become job-ready with confidence.
What is Data Analytics?
Definition of Data Analytics
Data Analytics simply means understanding data to make better decisions. Every day, businesses collect a lot of data—sales numbers, customer details, website visits, and more. But raw data alone is not useful.
Data analytics helps you clean, organize, and study that data to find meaningful insights. In simple terms, it answers questions like:
- What is happening?
- Why is it happening?
- What might happen next?
As someone who has trained many students over the years, I can say this clearly—data analytics is not about complicated tools, it’s about understanding patterns and making smart decisions from data.
Role in Modern Businesses
Today, almost every company depends on data. Whether it is a small startup or a big company, decisions are no longer based on guesswork. They are based on data.
For example:
- Companies track customer behavior to improve their products
- Marketing teams use data to run better campaigns
- Managers use reports to measure performance
Data analytics helps businesses:
- Reduce risks
- Improve efficiency
- Increase profits
- Understand customers better
In simple words, data analytics helps companies make decisions with confidence.
Real-World Examples
Let’s make this even easier with real-life examples:
- E-commerce (Amazon/Flipkart): Recommends products based on your past searches and purchases
- Banking: Detects unusual transactions to prevent fraud
- Healthcare: Helps doctors analyze patient data for better treatment
- Marketing: Shows which ads are working and which are not
Even when you scroll social media or watch videos, data analytics is working behind the scenes.
Why is Data Analytics Important in Today’s World?
Data-Driven Decision Making
In the past, many business decisions were based on assumptions or experience. Today, decisions are based on data. This is called data-driven decision making.
Instead of guessing, companies look at actual numbers and insights before taking action. For example, a company can check sales data to decide which product to promote or stop.
This approach helps in:
- Making accurate decisions
- Reducing risks
- Improving overall performance
As a trainer, I always tell beginners—learning data analytics means learning how to make smarter decisions with confidence.
Business Growth & Optimization
Every business wants to grow and improve its performance. Data analytics plays a key role in achieving this.
By analyzing data, companies can:
- Identify what is working and what is not
- Improve customer experience
- Reduce unnecessary costs
- Increase revenue
For example, a company can analyze customer feedback and improve its product or service. Small improvements based on data can lead to big business growth over time.
Demand Across Industries
Data analytics is not limited to one industry. It is used everywhere today.
Some common industries using data analytics:
- IT and Software
- Banking and Finance
- Healthcare
- E-commerce
- Marketing and Advertising
Because of this wide usage, the demand for data analysts is increasing every year.
Types of Data Analytics Explained
When you start learning data analytics, it’s important to understand that not all analysis is the same. Based on the goal, data analytics is divided into four types. Each one answers a different kind of question.
1. Descriptive Analytics – What Happened?
This is the most basic and commonly used type of data analytics. It focuses on understanding past data.
It helps answer questions like:
- How many sales did we make last month?
- How many users visited our website?
Key concepts:
- Historical data analysis: Looking at past data to understand performance
- Reports and dashboards: Visual summaries like charts and graphs
This type of analysis gives a clear picture of what has already happened.
2. Diagnostic Analytics – Why Did It Happen?
Once you know what happened, the next step is to understand why it happened.
It helps answer questions like:
- Why did sales drop this month?
- Why did website traffic increase suddenly?
Key concepts:
- Root cause analysis: Finding the exact reason behind a problem
- Pattern identification: Identifying trends and relationships in data
This type of analysis helps businesses fix problems and improve performance.
3. Predictive Analytics – What Is Likely to Happen?
This type of analytics focuses on the future. It uses past data to predict what might happen next.
It helps answer questions like:
- What will be the sales next month?
- Which customers are likely to leave?
Key concepts:
- Forecasting trends: Using data to estimate future outcomes
- Data-driven predictions: Making informed guesses using patterns
This is where data starts becoming very powerful for planning and strategy.
4. Prescriptive Analytics – What Should Be Done?
This is the most advanced level of data analytics. It not only predicts outcomes but also suggests actions.
It helps answer questions like:
- What is the best strategy to increase sales?
- Which product should we promote?
Key concepts:
- Decision recommendations: Suggesting the best actions
- Optimization strategies: Improving results using data insights
This type of analytics helps businesses make the right decisions at the right time.
Why Choose a Career in Data Analytics in 2026?
High Demand & Job Growth
Data is growing faster than ever, and companies need skilled people to handle it. Almost every industry is now using data to make decisions. Because of this, the demand for data analysts is increasing year by year.
From startups to large companies, everyone is looking for professionals who can understand data and provide useful insights. For freshers and beginners, this creates strong job opportunities with a stable career path.
Salary Potential
One of the biggest advantages of choosing data analytics is the salary growth. Even at the entry level, data analysts can earn competitive salaries compared to many other fields.
As you gain experience and improve your skills, your salary can increase significantly. Many professionals move into higher roles like senior analyst, data scientist, or analytics manager with better pay.
Career Flexibility
Data analytics offers a lot of flexibility in terms of career options. You are not limited to one industry. You can work in:
- IT and software companies
- Banking and finance
- Healthcare
- E-commerce
- Marketing and many more
You can also choose different career paths such as working full-time, freelancing, or even remote jobs.
Core Skills Required to Become a Data Analyst
To become a successful data analyst, you don’t need to start as an expert. What you need is the right set of core skills. These skills help you understand data, solve problems, and communicate results clearly.
a. Analytical Thinking
This is the most important skill for any data analyst. It means thinking logically and breaking down problems step by step.
- Problem-solving mindset: You should be able to look at a problem and figure out how data can help solve it
- Data interpretation: Understanding what the data is telling you and finding useful insights
Good analytical thinking helps you move from raw data to meaningful conclusions.
b. Statistical Knowledge
Basic statistics helps you understand data more accurately. You don’t need advanced math, but you should know the fundamentals.
- Basic statistics: Concepts like mean, median, and probability
- Data understanding: Knowing how data behaves and how to analyze it properly
This knowledge helps you make correct decisions based on data instead of assumptions.
c. Data Cleaning & Preparation
In real-world projects, data is rarely perfect. Most of the time, it is messy and incomplete.
- Handling raw data: Removing duplicates, fixing errors, and dealing with missing values
- Data preprocessing: Preparing data so it can be analyzed easily
A good data analyst spends a lot of time cleaning data because clean data leads to accurate results.
d. Communication Skills
Understanding data is not enough. You also need to explain your findings clearly to others.
- Presenting insights: Sharing results using charts, reports, or dashboards
- Business storytelling: Explaining data in a simple way so non-technical people can understand
Strong communication skills help you turn data insights into real business actions.
Step-by-Step Data Analytics Roadmap (Beginner to Job-Ready)
This roadmap is designed to give you a clear, step-by-step direction. If you follow this consistently, you can move from beginner to job-ready with confidence.
Step 1: Understand the Role of a Data Analyst
Before learning tools, you must understand what a data analyst actually does in a company.
- Responsibilities: Collecting data, cleaning it, analyzing it, and presenting insights
- Real-world workflow: Data collection → cleaning → analysis → visualization → decision-making
In simple words, a data analyst converts raw data into useful information that helps businesses make better decisions.
This step gives you clarity and helps you understand why you are learning each skill.
Step 2: Learn Excel and SQL
Start with tools that are simple and widely used in the industry.
- Data handling basics: Cleaning data, removing duplicates, formatting, and basic calculations in Excel
- Querying data: Using SQL to fetch data from databases, filter records, and combine tables
Most companies use Excel for reporting and SQL for handling large data.
If your Excel and SQL are strong, you already cover a big part of a data analyst’s daily work.
Step 3: Study Statistics for Data Analysis
Statistics helps you understand data logically instead of just looking at numbers.
- Mean, median, probability, distributions: Basic concepts to summarize and interpret data
- Helps you understand patterns, trends, and variations
You don’t need advanced mathematics. Just focus on understanding how data behaves.
This step improves your decision-making ability.
Step 4: Learn Python or R
Once your basics are strong, move to programming for deeper analysis.
- Data manipulation: Handling large datasets using tools like Pandas
- EDA basics (Exploratory Data Analysis): Finding trends, patterns, and relationships in data
Python is highly recommended for beginners because it is easy to learn and widely used in the industry.
This step helps you move beyond basic analysis and handle real-world data efficiently.
Step 5: Learn Data Visualization Tools
Data is useful only when it is presented clearly.
- Dashboard creation: Build interactive dashboards using Power BI or Tableau
- Business reporting: Present insights using charts and visuals
Good visualization helps non-technical people understand data quickly.
This is one of the most important skills for a data analyst.
Step 6: Work on Real-Time Projects
This is where real learning happens. Without projects, your knowledge will remain theoretical.
- Case studies: Solve real business problems like sales analysis or customer behavior
- End-to-end analysis: From data cleaning to final dashboard
Projects help you gain confidence and practical experience.
Recruiters always look for candidates who have worked on real data.
Step 7: Build a Strong Portfolio
Your portfolio is your proof of skills.
- GitHub projects: Upload your work and show your coding and analysis skills
- Resume-ready work: Include 2–4 strong projects with clear explanations
A good portfolio can make a big difference, especially for freshers.
It shows what you can do, not just what you know.
Step 8: Get Certified in Data Analytics
Certification is not everything, but it adds value to your profile.
- Industry-recognized certifications: Show that you have completed structured training
- Helps build trust with recruiters and hiring managers
Focus on learning first, and then use certification as support for your profile.
Step 9: Apply for Internships or Entry-Level Jobs
Many people wait until they feel “perfect,” but that is a mistake. Start applying early.
- Job platforms: LinkedIn, Naukri, Indeed, company career pages
- Application strategy: Apply regularly, customize your resume, and track applications
You will learn a lot from interviews, even if you don’t get selected initially.
Consistency is key in this step.
Step 10: Network and Keep Learning
Your growth does not stop after getting a job.
- LinkedIn networking: Connect with professionals, follow industry experts, and stay updated
- Continuous upskilling: Learn new tools, improve skills, and work on advanced topics
The data field is always evolving. Staying updated will help you grow faster in your career.
Technical Tools and Technologies You Must Learn
To become a data analyst, learning the right tools is very important. These tools help you collect, clean, analyze, and present data in a practical way. The good part is—you don’t need to learn everything at once. You can learn step by step.
Excel for Data Analysis
Excel is usually the first tool every beginner starts with. It is simple, easy to learn, and widely used in companies.
You will use Excel for:
- Data cleaning and formatting
- Basic calculations and analysis
- Creating charts and simple dashboards
Even today, many companies rely on Excel for daily reporting.
SQL for Data Extraction
SQL is used to work with databases. It helps you fetch and manage large amounts of data.
You will learn:
- How to retrieve data using queries
- Filtering and sorting data
- Combining data from multiple tables
SQL is a must-have skill because most company data is stored in databases.
Python / R for Analysis
Python and R are programming languages used for deeper data analysis.
With Python or R, you can:
- Handle large datasets
- Perform advanced analysis
- Automate repetitive tasks
Python is more commonly used by beginners because of its simple syntax and strong community support.
Power BI / Tableau for Visualization
These tools help you convert data into visual dashboards.
You will learn:
- Creating interactive dashboards
- Visualizing data using charts and graphs
- Presenting insights in a clear way
Good visualization makes it easier for businesses to understand data quickly.
Basic Cloud Tools (Optional)
Cloud platforms like AWS, Azure, or Google Cloud are used to store and process data online.
While this is optional for beginners, having basic knowledge can be an added advantage as you grow in your career.
Why Choose DataAnalyticsMasters for Your Learning Path
Choosing the right training institute plays a very important role in your career. At Data Analytics Masters, the focus is not just on teaching tools, but on making you job-ready with practical skills and real-world understanding.
Industry-Expert Trainers
You will learn from trainers who have real industry experience. They don’t just teach theory—they explain how data analytics is actually used in companies.
This helps you:
- Understand real business problems
- Learn practical approaches
- Gain insights beyond textbooks
Practical Training Approach
The training is designed to be hands-on and easy to follow. Instead of only learning concepts, you will work on real datasets and practical tasks.
This ensures:
- Better understanding of topics
- Confidence in using tools
- Strong foundation in data analytics
Real-Time Projects
Projects are a key part of the learning process. You will work on real-world case studies that reflect actual business scenarios.
This helps you:
- Apply what you learn
- Build a strong portfolio
- Get ready for real job roles
Placement Support
The goal is not just learning—it is helping you start your career.
You will get support with:
- Resume building
- Interview preparation
- Job assistance
This guidance increases your chances of getting placed as a data analyst.
Future Trends in Data Analytics
Data analytics is growing very fast, and the way companies use data is changing every year. If you are planning to build a career in this field, it is important to understand where the future is heading.
AI & Automation
Artificial Intelligence (AI) is becoming a major part of data analytics. Many tasks that were done manually are now automated using AI tools.
For example:
- Automatic data cleaning
- Smart data predictions
- AI-generated reports
This does not replace data analysts. Instead, it helps them work faster and focus more on decision-making.
In the future, analysts who understand AI tools will have a strong advantage.
Real-Time Analytics
Earlier, companies used to analyze data after days or weeks. Now, businesses need instant insights.
Real-time analytics means:
- Analyzing data as soon as it is generated
- Making quick decisions based on live data
For example:
- Tracking live website traffic
- Monitoring sales in real-time
- Detecting fraud instantly
This trend is increasing because businesses want faster and more accurate decisions.
Big Data Growth
Every day, huge amounts of data are being created from apps, websites, social media, and devices.
This is called big data.
Because of this:
- Companies need better tools to manage large data
- Data analysts need to work with bigger datasets
- Advanced technologies like cloud and distributed systems are becoming important
In simple terms, more data means more opportunities for data analysts.
Demand for Data Professionals
As data usage increases, the demand for skilled professionals is also growing.
Companies are actively hiring:
- Data Analysts
- Business Analysts
- Data Engineers
This demand is not limited to IT companies. It is growing in finance, healthcare, retail, and many other industries.
For freshers and working professionals, this is a big opportunity.
If you learn the right skills now, you can build a strong and stable career in data analytics.
FAQs
1. What is the best roadmap to become a data analyst?
The best roadmap starts with basics, then Excel, SQL, statistics, Python, visualization tools, projects, and portfolio building. Following a structured path helps you become job-ready step by step.
2. Can beginners learn data analytics?
Yes, beginners can learn data analytics easily. The roadmap is designed step-by-step, starting from basics. With consistent practice, even non-technical learners can build strong skills and start a career.
3. How long does it take to become a data analyst?
It usually takes 4 to 6 months with consistent learning and practice. The duration depends on your dedication, learning pace, and how much time you spend on projects.
4. Which tools are required for data analytics?
You need to learn Excel, SQL, Python or R, and visualization tools like Power BI or Tableau. These tools help you analyze, manage, and present data effectively.
5. Is coding mandatory for data analytics?
Coding is not mandatory at the beginning. You can start with Excel and SQL. Later, learning Python or R helps in advanced analysis and improves your career opportunities.
6. Do I need a technical background to learn data analytics?
No, a technical background is not required. Anyone with basic logical thinking and willingness to learn can start data analytics and build skills gradually through structured learning.
7. What kind of projects should I build?
You should work on real-world projects like sales analysis, customer segmentation, and business dashboards. These projects help you gain practical experience and strengthen your portfolio.
8. How important is a portfolio for a data analyst?
A portfolio is very important. It shows your practical skills to employers. Strong projects with clear explanations can increase your chances of getting shortlisted for interviews.
9. Can I switch my career to data analytics?
Yes, many professionals switch to data analytics from non-technical fields. With proper training and practice, you can transition into this field and explore new career opportunities.
10. Are certifications important in data analytics?
Certifications add value to your resume but are not enough alone. Practical skills, projects, and hands-on experience are more important for getting a job in data analytics.

 in Hyderabad by Brolly.Group