
Data Analytics Resume

A well-structured resume is your key to success in the competitive field of data analytics. In today’s data-driven landscape, businesses rely on skilled data analysts to uncover insights, streamline processes, and support strategic decisions. Since your resume is the first impression you make on potential employers, it should effectively highlight your technical expertise, analytical mindset, and ability to turn raw data into actionable insights.
Whether you’re an entry-level candidate or a seasoned professional, your resume must demonstrate your ability to handle large datasets, conduct statistical analysis, create compelling visualizations, and derive data-backed recommendations. Below is a comprehensive Data Analyst Resume template designed to help you stand out in job applications.
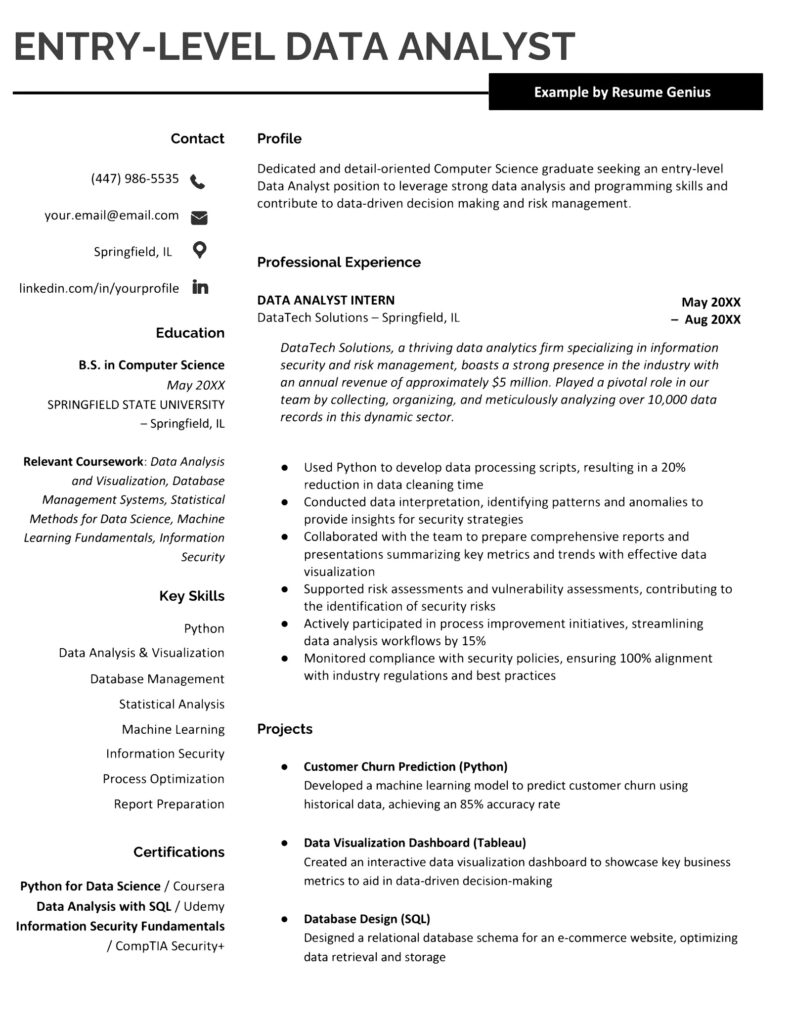
Key Components of a Data Analytics Resume (Entry-Level)
To make sure your resume is clear, concise, and impactful, include the following sections:
a. Header
The header should clearly include:
- Your Full Name
- Contact Information (phone number, email)
- LinkedIn Profile (if available)
- Data Analytics Masters link (if applicable)
Example: John Doe
📧 johndoe@example.com | 📞 123-456-7890 | 🌐 linkedin.com/in/johndoe | 🌐 https://dataanalyticsmasters.in/johndoe
b. Professional Summary/Objective
Your professional summary should be a brief snapshot of who you are, what you bring to the table, and what your career goals are. If you’re an experienced data analyst, focus on your accomplishments. If you’re a beginner, highlight your enthusiasm and foundational skills.
Example (Entry-Level):
Recent graduate with strong analytical skills and experience in SQL, Python, and data visualization. Passionate about using data to solve real-world business problems and contribute to strategic decision-making.
c. Key Skills
In this section, highlight the technical and soft skills that are most relevant to the data analytics role. Be specific, and use industry-standard tools.
Technical Skills:
- SQL, Python (Pandas, NumPy), R
- Data Visualization (Tableau, Power BI)
- Statistical Analysis (Regression, Time Series)
- Machine Learning (Scikit-learn, TensorFlow)
- Data Cleaning & Manipulation
- Big Data Tools (Hadoop, Spark)
Soft Skills:
- Problem-solving and critical thinking
- Communication and presentation skills
- Teamwork and collaboration
- Attention to detail.
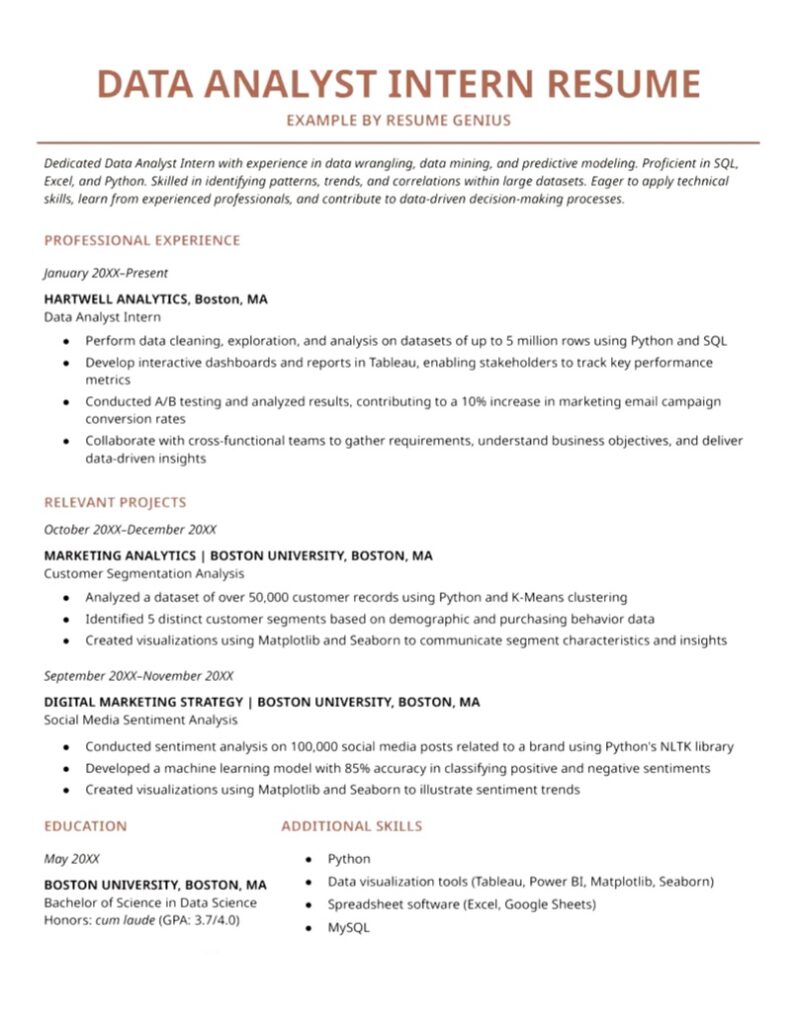
Data Analytics Resume-Intern
A Data Analytics Resume – Intern serves as a crucial tool to showcase your technical skills, analytical mindset, and problem-solving abilities. In today’s data-driven world, businesses rely on data analysts to process, visualize, and interpret data for better decision-making. As an intern, your resume should highlight your proficiency in Python, SQL, Excel, and data visualization tools like Tableau and Power BI.
Your Data Analytics Intern Resume must emphasize data cleaning, exploratory analysis, and statistical modeling. Employers value candidates who can handle large datasets, develop dashboards, and provide data-driven insights. If you’ve worked on projects like customer segmentation, predictive modeling, or sentiment analysis, include them to demonstrate practical experience.
Additionally, highlight soft skills such as critical thinking, communication, and problem-solving, as they help in translating complex data into actionable insights. Relevant academic coursework in statistics, machine learning, and database management further strengthens your resume.
Certifications like Google Data Analytics or SQL for Data Science enhance your credibility. Keeping your Data Analytics Intern Resume concise, structured, and results-oriented improves your chances of securing an internship and kickstarting your career in data analytics.
Key Components of a Data Analytics Resume (Interns)
a. Header
The header should clearly include:
- Your Full Name
- Contact Information (phone number, email)
- LinkedIn Profile (if available)
- DataAnalytics Masters Link (if applicable)
Example: John Doe
📧 johndoe@example.com | 📞 123-456-7890 | 🌐 linkedin.com/in/johndoe | 🌐www.dataanalyticsmasters.in/johndoe
PROFESSIONAL EXPERIENCE
January 202X – Present
ABC ANALYTICS, New York, NY
Data Analyst Intern
- Cleaned, processed, and analyzed datasets of up to 5 million rows using Python and SQL.
- Developed interactive Tableau dashboards, improving KPI tracking for stakeholders.
- Conducted A/B testing, leading to a 12% increase in email campaign conversion rates.
- Collaborated with cross-functional teams to identify data trends and support business strategies.
RELEVANT PROJECTS
October 202X – December 202X
CUSTOMER SEGMENTATION ANALYSIS | XYZ UNIVERSITY, New York, NY
- Analyzed 50,000+ customer records using Python and K-Means clustering.
- Identified 5 distinct customer segments based on demographic and purchasing patterns.
- Created visualizations using Matplotlib and Seaborn to showcase insights.
September 202X – November 202X
SOCIAL MEDIA SENTIMENT ANALYSIS | XYZ UNIVERSITY, New York, NY
- Conducted sentiment analysis on 100,000+ social media posts using Python’s NLTK library.
- Developed a machine learning model with 85% accuracy to classify positive and negative sentiments.
- Created visualizations using Matplotlib and Seaborn to illustrate sentiment trends.
EDUCATION
May 2021
XYZ UNIVERSITY, New York, NY
Bachelor of Science in Data Science
Honors: cum laude (GPA: 3.7/4.0)
ADDITIONAL SKILLS
- Python
- SQL & MySQL
- Data visualization (Tableau, Power BI, Matplotlib, Seaborn)
- Spreadsheet software (Excel, Google Sheets)
- Machine learning basics
PROJECT EXPERIENCE
Customer Segmentation Analysis
- Analyzed 50,000+ customer records using Python & K-Means clustering.
- Identified 5 distinct customer segments based on demographic and purchasing behavior.
- Created interactive visualizations in Seaborn & Matplotlib to present insights.
Social Media Sentiment Analysis
- Conducted sentiment analysis on 100,000+ social media posts using NLTK & Python.
- Built a machine learning model with 85% accuracy to classify positive and negative sentiments.
- Developed data visualizations using Tableau & Matplotlib to showcase findings.
Sales Data Analysis
- Processed 1 million+ rows of sales data using SQL & Pandas.
- Built interactive Tableau dashboards to track sales performance.
- Provided insights that led to a 10% increase in revenue for a case study.
Programming & Analytics: Python, R, SQL, Excel
Data Visualization: Tableau, Power BI, Matplotlib, Seaborn
Technical Skills
Databases: MySQL, PostgreSQL
Machine Learning Basics: Scikit-learn, TensorFlow (Beginner)
Business Tools: Google Sheets, Microsoft Office
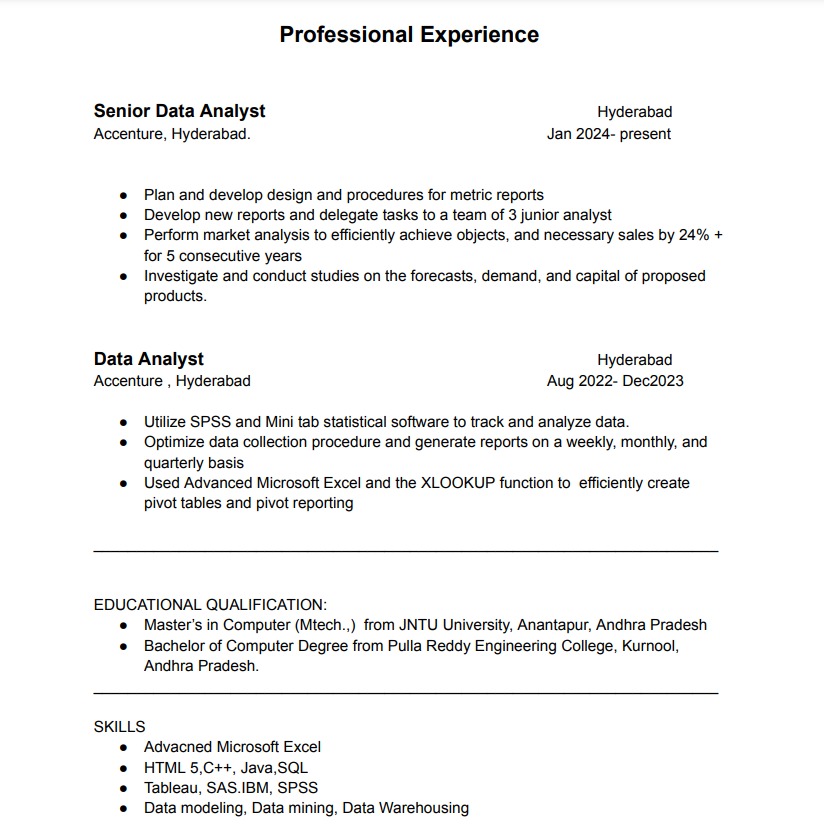
Data Analytics Resume-Senior Level
A Senior Data Analytics Resume should emphasize technical expertise, leadership, and business impact. As a seasoned professional, your role extends beyond data analysis—you drive strategic decision-making, optimize business processes, and mentor junior analysts.
In this role, proficiency in SQL, Python, R, Tableau, and Power BI is crucial for handling large datasets, performing statistical analysis, and creating insightful visualizations. Employers seek candidates who can develop predictive models, automate workflows, and present complex data findings to stakeholders.
Key responsibilities for a senior-level role include:
- Leading data-driven projects that enhance operational efficiency and boost revenue.
- Designing and implementing machine learning models to forecast trends and optimize strategies.
- Building advanced dashboards and automating reporting processes using Tableau, Power BI, or Looker.
- Performing A/B testing and hypothesis testing to refine business strategies.
- Collaborating with cross-functional teams to align data insights with business objectives.
- Mentoring junior analysts and improving data-driven decision-making within the organization.
A well-crafted Senior Data Analyst Resume should highlight measurable achievements, such as reducing costs, increasing customer retention, or improving efficiency through data solutions. Structuring your resume with quantifiable results, action verbs, and key tools will make you a strong candidate in today’s competitive job market.
Key Components of a Data Analytics Resume (Senior Level)
a. Header
The header should clearly include:
- Your Full Name
- Contact Information (phone number, email)
- LinkedIn Profile (if available)
- DataAnalytics Masters Link (if applicable)
Example: John Doe
📧 johndoe@example.com | 📞 123-456-7890 | 🌐 linkedin.com/in/johndoe | 🌐www.dataanalyticsmasters.in/johndoe
Experienced Senior Data Analyst with over 4+ years of expertise in data analysis, predictive modeling, and business intelligence. Skilled in SQL, Python, R, and Tableau, with a strong understanding of statistical methods and machine learning techniques. Proven track record in providing actionable insights and driving data-driven decision-making to improve business operations. Adept at collaborating with cross-functional teams to design and implement data solutions that optimize business performance.
SKILLS
- Data Analysis & Visualization: Advanced proficiency in SQL, Python, R, and Excel; expert in Tableau, Power BI, and Looker.
- Statistical Modeling: Regression analysis, time series analysis, A/B testing, hypothesis testing, and clustering.
- Machine Learning: Experience with sci-kit-learn, TensorFlow, and ML algorithms for predictive modeling and classification.
- Big Data Technologies: Hadoop, Spark, AWS, and Google Cloud Platform.
- Business Intelligence: Strong ability to translate complex data into clear, actionable insights for stakeholders.
- Project Management: Agile methodologies, Scrum, and JIRA for project tracking and collaboration.
- Communication: Excellent communication skills for presenting data insights to non-technical stakeholders.
EXPERIENCE
Senior Data Analyst
XYZ Corporation | New York, NY
March 2020 – Present
- Lead data analysis projects, providing insights and actionable recommendations that improved operational efficiency by 15%.
- Developed and maintained dashboards using Tableau, reducing reporting time by 30% and enabling real-time data-driven decisions.
- Collaborated with the marketing team to develop customer segmentation models, resulting in a 20% increase in targeted campaign success rates.
- Conducted exploratory data analysis (EDA) and applied statistical modeling to analyze sales trends and predict future demand, improving inventory planning.
- Mentored junior analysts, guiding advanced analytical techniques and tools.
Data Analyst
ABC Technologies | New York, NY
June 2015 – February 2020
- Analyzed large datasets to uncover insights that informed marketing, sales, and product development business strategies.
- Built and optimized SQL queries for data extraction, reporting, and analysis.
- Automated weekly reports using Python scripts, reducing manual work by 40%.
- Performed market analysis, identifying trends and customer behavior patterns that contributed to a 10% increase in customer retention.
EDUCATION
Master of Science in Data Science
University of New York | New York, NY
Graduated: May 2015
Bachelor of Science in Statistics
University of New York | New York, NY
Graduated: May 2012
CERTIFICATIONS
- Microsoft Certified: Data Analyst Associate (2023)
- Google Data Analytics Professional Certificate (2022)
- Certified Analytics Professional (CAP) – In Progress
PROJECTS
Customer Churn Prediction Model
- Developed a machine learning model using Python to predict customer churn, achieving an accuracy rate of 85%.
- Used data preprocessing techniques such as feature scaling, imputation, and encoding to handle missing and categorical data.
Sales Forecasting Dashboard
- Designed a sales forecasting dashboard in Tableau, integrating data from multiple sources to predict future sales trends.
- Collaborated with the finance department to ensure forecasts aligned with budget planning.
Crafting the Perfect Data Analytics Resume: Your Path to Success
A well-crafted Data Analytics Resume is your key to breaking into and thriving in the competitive world of data analytics.
In today’s data-driven landscape, companies depend on skilled professionals to turn raw data into valuable insights that guide critical decisions and boost business performance.
Since your resume is often the first thing a potential employer sees, it’s your chance to make a strong impression by clearly showcasing your skills and ability to deliver actionable solutions.
Creating an outstanding Data Analytics Resume goes beyond listing your education and past roles.
- It’s about emphasizing the technical tools you excel in—like SQL, Python, and Tableau—and backing that up with real-world accomplishments.
- Employers want to see evidence of your analytical thinking, how you’ve solved problems, and the impact your insights have had on driving results.
Equally important are the soft skills you bring to the table.
- Whether it’s critical thinking, attention to detail, or the ability to communicate complex data in a clear and compelling way, these qualities are vital for converting numbers into strategies that make a difference.
Think of your resume as a story of your expertise—a blend of technical proficiency and problem-solving abilities.
- By highlighting both, you position yourself as a professional who can analyze complex datasets, uncover meaningful trends, and present them in a way that supports smarter decision-making.
This guide is here to help you craft a resume that captures attention, whether you’re just starting your career or looking to take it to the next level.
A strong resume isn’t just a document; it’s your ticket to securing a rewarding role in the ever-evolving field of data analytics.
The Power of 'Streamlined' in Your Data Analytics Resume
1. Understanding the Purpose:
A data analyticsresume is your golden ticket to standing out in a sea of applicants. Think of it as your sidekick that shows off your skills, experience, and what makes you awesome. But here’s the trick: just listing skills like SQL or Python isn’t enough. You’ve got to show how you’ve used those skills to solve real-world problems. For example, instead of saying “I know SQL,” try “Used SQL to analyze sales data, helping increase revenue by 20%.”
Even if you don’t have much experience, don’t sweat it! Personal projects or coursework can work wonders. Maybe you analyzed a dataset on something quirky like pizza consumption? Throw it in there! Employers care more about your problem-solving abilities than the job title.
Also, don’t forget to highlight outcomes—numbers make your achievements pop! For instance, “Developed dashboards that saved 10 hours of weekly work” is better than just listing “Created dashboards.”
Lastly, tailor your resume to each job. A little customization goes a long way. And remember, your resume should be clean and easy to read. Keep it organized, and concise, and you’re golden! A strong data analytics resume should:
Demonstrate your proficiency in analytical tools and technologies:
Demonstrating proficiency in analytical tools and technologies is key to showcasing your value. I have hands-on experience with various tools like Excel for data manipulation, SQL for database management, and Python for data analysis and automation. I’ve used Tableau to create interactive dashboards, turning complex data into insightful visualizations that drive business decisions. Additionally, I am familiar with Power BI for reporting and analysis. My experience has allowed me to not only manage and clean large datasets but also generate actionable insights that contribute to informed decision-making.
Showcase your ability to solve real-world business problems using data:
When it comes to solving real-world business problems using data, the right tools and a strategic approach are essential. By utilizing technologies like SQL, Python, and Tableau, businesses can uncover valuable insights that lead to actionable solutions.
For example, SQL can be used to analyze sales data, identify trends, and understand customer behavior, which can help boost conversion rates and optimize marketing strategies. Python is a powerful tool for automating repetitive tasks, improving workflow efficiency, and freeing up time for more impactful work. With Tableau, businesses can transform complex data into clear, interactive visualizations, enabling teams to make informed, data-driven decisions.
The key to solving business problems is not just in the tools themselves, but in how they are used to align with business goals. By effectively combining technical skills with a deep understanding of the business context, organizations can leverage data to create powerful strategies that drive growth and improve performance.
Highlight measurable results achieved in past roles or projects:
When highlighting measurable results from past roles or projects, focus on the tangible outcomes you’ve achieved. For example, using SQL, an analyst might identify key customer trends, resulting in a 20% increase in sales through targeted marketing strategies. In another project, leveraging Python to build a predictive model can lead to a 15% reduction in inventory costs by accurately forecasting demand. Creating interactive dashboards with Tableau could streamline reporting and save the team 10 hours per week. These measurable results demonstrate how applying data analytics tools can significantly improve efficiency and profitability.
2. Structuring Your Data Analytics Resume
Crafting a well-structured resume is key to landing your dream data analytics role. Here’s a guide to ensure your resume is clear, impactful, and tailored to showcase your expertise.
Detail-oriented data analyst with 3+ years of experience in SQL, Python, and Tableau, skilled in uncovering actionable insights to drive business growth.
Include relevant projects that demonstrate your technical expertise and ability to solve problems. For instance:
- Built a predictive model in Python that improved customer retention by 20%.
- Created interactive dashboards in Tableau for executive reporting.
To ensure clarity and readability, follow this structure:
a. Header:
Include your:
- Full Name
- Contact Information (phone number, email)
- LinkedIn Profile (if updated)
- Portfolio/GitHub Link (optional but recommended for showcasing projects)
Example:
John Doe
Email:dataanalyticsmasters.in@gmail.com | Phone:+919948801222
Brolly:Brollyacademy.com
b. Professional Summary/Objective:
our professional summary or objective is the opening statement on your resume that gives a quick snapshot of who you are, your expertise, and your career goals. Here’s how to craft it effectively:
Professional Summary (For Experienced Candidates):
A professional summary highlights your skills and accomplishments concisely, and impactfully. Example:
“Results-driven data analyst with 5+ years of experience in SQL, Python, and Tableau. Proven ability to interpret and analyze data to drive business solutions, including a 20% sales increase through trend analysis. Adept at creating interactive dashboards, streamlining processes, and presenting insights to stakeholders.”
Objective Statement (For Entry-Level Candidates):
An objective is ideal for those starting their careers, showcasing aspirations and relevant skills. Example:
“Motivated recent graduate with a strong foundation in data analytics, including expertise in Excel, SQL, and Python. Seeking an entry-level data analyst role to apply skills in data visualization and problem-solving to drive business success.”
Tips for Crafting an Effective Summary or Objective:
- Tailor it to the job description.
- Use quantifiable achievements where possible.
- Focus on your skills and how they align with the role.
Keep it concise—two to three sentences max!
The summary is a snapshot of your career and highlights your key qualifications in a few sentences.
- For experienced professionals: Mention your years of experience, expertise in tools like SQL, Python, and Tableau, and a notable achievement.
- For freshers: Focus on your education, certifications, and enthusiasm for using data to solve business challenges.
Example:
Data analyst with 4+ years of experience in leveraging SQL, Python, and Tableau to drive data-driven decision-making. Successfully optimized business processes, resulting in a 15% increase in efficiency. Passionate about using data to uncover actionable insights..
c. Key Skills
Your Key Skills section should highlight the tools, technologies, and abilities that make you a standout candidate for a data analytics role. Organize this section to emphasize both technical expertise and soft skills, tailored to the job you’re applying for.
Technical Skills:
- Data Analysis & Manipulation: SQL, Python (Pandas, NumPy), R
- Data Visualization: Tableau, Power BI, Matplotlib, Seaborn
- Statistical Analysis: Hypothesis testing, Regression, Time Series Analysis
- Database Management: MySQL, PostgreSQL, MongoDB
- Big Data Tools: Hadoop, Spark (if relevant)
- Spreadsheets: Advanced Excel (Pivot Tables, VLOOKUP, Macros)
- Reporting Tools: Google Data Studio, Microsoft Excel Dashboards
Machine Learning (optional for advanced roles): Scikit-learn, TensorFlow
Soft Skills:
- Problem-solving and critical thinking
- Strong communication and presentation skills
- Collaboration and teamwork
- Attention to detail
- Adaptability to evolving tools and methodologies.
Example Format:
Key Skills:
- Data Analysis: SQL, Python, Excel.
- Visualization: Tableau, Power BI
- Statistical Techniques: Regression, Forecasting.
- Communication: Presenting technical insights to non-technical audiences.
d. Work Experience
Work Experience
The Work Experience section is where you showcase your professional achievements and the impact you’ve made in previous roles. Use a reverse-chronological format, starting with your most recent experience, and highlight measurable results.
Structure:
- Job Title, Company Name – Location
[Month/Year] – [Month/Year] - Responsibilities & Achievements:
- Use bullet points to keep it concise.
- Begin each point with an action verb (e.g., “Developed,” “Implemented,” “Analyzed”).
- Focus on measurable outcomes where possible (e.g., “Increased efficiency by 20%”).
Example:
Data Analyst, XYZ Corporation – New York, NY
January 2022 – Present
- Analyzed large datasets using SQL and Python, identifying trends that increased sales by 15%.
- Created interactive dashboards in Tableau to provide real-time insights, improving decision-making speed by 25%.
- Automated data cleaning processes with Python, reducing manual work by 30 hours per month.
- Collaborated with cross-functional teams to design KPIs that enhanced operational efficiency by 10%.
Junior Data Analyst, ABC Solutions – Banglore, India
June 2020 – December 2021
- Conducted exploratory data analysis using Excel and R to identify customer churn patterns.
- Built predictive models to forecast inventory demand, reducing excess stock by 12%.
- Presented key findings to stakeholders, leading to a 20% improvement in campaign effectiveness.
Highlight your professional experience, starting with the most recent role. Use bullet points to describe your responsibilities and achievements. Quantify your impact whenever possible.
Example:
Data Analyst – XYZ Corporation
Jan 2020 – Present
- Developed interactive dashboards in Tableau to track sales performance, reducing reporting time by 30%.
- Automated data cleaning processes using Python, improving efficiency by 20%.
- Conducted A/B testing, resulting in a 10% increase in customer retention.
e. Education
The Education section highlights your academic qualifications, certifications, and relevant coursework. Structure it clearly, listing your highest degree first, followed by certifications and training programs.
Structure:
- Degree/Certification – Institution Name
[Month/Year] – [Month/Year] - Relevant coursework, projects, or honors (optional but impactful).
Example for Formal Education:
Data Analytics Masters – Training Inst.
August 2024 – May 2024
- Relevant Coursework: Statistical Analysis, Machine Learning, Data Visualization
- Thesis: “Predictive Analytics for E-commerce: Increasing Customer Retention through Machine Learning Models”
Bachelor of Science in Computer Science – ABC University
August 2021 – May 2024
- Relevant Coursework: Database Management, Python Programming, Linear Algebra.
Tips:
- Include certifications relevant to data analytics, such as those from Google, Microsoft, or Tableau.
- Add online courses or bootcamps if they align with the job (e.g., DataCamp, Udemy).
- Highlight projects or coursework that demonstrate your practical experience.
Example for Certifications (if applicable):
Google Data Analytics Professional Certificate – Coursera
Completed: March 2024Microsoft Certified: Data Analyst Associate – Microsoft
Completed: January 2024Include your educational background, starting with the highest degree. Mention relevant coursework if you’re a fresher.
Example:
Data Analytics Masters
Hyderabad | Jun2024 – Dec2024- Relevant Coursework: Machine Learning, Advanced SQL, Predictive Analytics
f. Certifications
The Certifications section is where you highlight additional credentials that validate your skills and expertise in data analytics. Include certifications that are relevant to the role and showcase your commitment to professional development.
Structure:
- Certification Name – Issuing Organization
[Month/Year Completed]
Example:
- Google Data Analytics Professional Certificate – Coursera
Completed: March 2023 - Microsoft Certified: Data Analyst Associate – Microsoft
Completed: January 2023 - Tableau Desktop Specialist Certification – Tableau
Completed: November 2022 - IBM Data Science Professional Certificate – IBM via Coursera
Completed: August 2022 - AWS Certified Machine Learning – Specialty – Amazon Web Services
Completed: June 2022
Tips:
- List the most relevant and recognized certifications first.
- If you’re pursuing a certification, mention it as “In Progress” with an expected completion date.
- Avoid listing irrelevant certifications to maintain focus on the job requirements.
- If space permits, briefly mention skills acquired during certification (e.g., “Proficient in SQL and Python for data analysis”).
Showcase relevant certifications to demonstrate your commitment to learning.
Examples:
- Google Data Analytics Professional Certificate
- Tableau Desktop Specialist Certification
- Microsoft Certified: Data Analyst Associate
g. Projects
Highlight personal or professional projects that demonstrate your expertise.
Example:
Project: Customer Churn Prediction
- Used Python and machine learning algorithms to predict customer churn with 85% accuracy.
- Visualized findings using Tableau, enabling the client to implement a retention strategy.
3. Tips for Writing an Effective Data Analytics Resume
a. Tailor Your Resume for Each Job
Customize your resume to include keywords from the job description. For instance, if the job emphasizes SQL and Tableau, highlight those skills prominently.
b. Use Action Verbs
Start each bullet point with action verbs like “analyzed,” “developed,” “optimized,” or “visualized” to create a dynamic impression.
c. Quantify Achievements
Wherever possible, quantify the impact of your work. Numbers help employers understand the value you bring.
Example:
- Increased data processing speed by 40% by optimizing SQL queries.
4. Common Mistakes to Avoid
Being Too Vague About Your Skills: Don’t just say “good with data” or “experience with analytics tools.” Be specific! List out the tools, languages, and techniques you’ve used (e.g., Python, SQL, Tableau, machine learning).
Not Tailoring It to the Job: A generic resume won’t cut it! Customize your resume to highlight the skills and experience relevant to the specific data analytics job you’re applying for.
Ignoring Soft Skills: While technical skills are a must, soft skills like problem-solving, communication, and teamwork are also key in data analytics. Make sure to highlight those too.
Listing Too Much Unrelated Experience: If you’ve got experience that isn’t relevant to the job, consider leaving it off. Focus on roles and projects that showcase your data analysis abilities.
Not Quantifying Achievements: Don’t just say you “analyzed data”; show what impact you made! Use numbers to back up your achievements (e.g., “Improved data accuracy by 20%” or “Reduced report generation time by 30%”).
Forgetting to Include Projects: If you have personal or academic projects, especially those that showcase your data skills, include them! Even if you’re new to the field, personal projects are a great way to demonstrate your capabilities.
Too Long or Too Short: A resume should be concise, but don’t make it so short that it feels like you’re hiding something. Keep it to the point (1-2 pages), but make sure you show your value.
a. Overloading with Technical Jargon
While it’s important to showcase your technical skills, avoid using too much jargon. Ensure your resume is understandable even to non-technical recruiters.
b. Spelling and Grammar Errors
Proofread your resume to ensure there are no mistakes. A single typo can create a negative impression.
c. Irrelevant Information
Stick to skills, experiences, and achievements relevant to data analytics. Avoid unnecessary details like hobbies unless they align with the role.
5.Creating an ATS-Friendly Resume
Most companies use Applicant Tracking Systems (ATS) to screen resumes. To make your resume ATS-friendly:
- Use standard fonts like Arial or Times New Roman.
- Avoid graphics, tables, or unusual formatting.
- Use clear headings (e.g., “Work Experience,” “Skills”)
6. Sample Data Analytics Resume
John Doe
Data Analyst
📧 johndoe@example.com | 📞 9948801222| 🌐 brollyacademy.com
Professional Summary
Results-driven data analyst with 3+ years of experience in SQL, Python, and Tableau. Adept at deriving insights from complex datasets and creating actionable strategies to optimize business operations.
Skills
- Technical: Python, SQL, Tableau, Power BI, Hadoop
- Soft Skills: Communication, Problem-Solving, Attention to Detail
Work Experience
Data Analyst – ABC Corp
June 2023 – Present
- Analyzed customer data to identify trends, increasing customer satisfaction by 20%.
- Automated reporting processes, saving 15 hours of manual effort weekly.
Education
Bachelor of Technology in Computer Science
XYZ University | 2020 – 2023
Conclusion
When updating your resume for a data analytics role, it’s crucial to avoid common mistakes that could hinder your chances of standing out.
1. Be Specific About Your Technical Skills
- Don’t just say you’re proficient in data analysis; list the exact tools and technologies you’re familiar with, such as Python, R, SQL, Excel, Tableau, or Power BI.
- Hiring managers want to see that you have hands-on experience with the tools they’ll be using.
- Highlight relevant certifications and courses that demonstrate your commitment to staying updated in the field.
2. Avoid a Generic Resume
- Neglecting to tailor your resume for each job application is a key mistake.
- A generic resume won’t capture the attention of hiring managers who are looking for specific skills related to their open positions.
- Customize your resume for each job to highlight the skills and experiences that directly align with the job description.
- Quantify your achievements—data analytics is all about impact.
- For example, “Analyzed customer data to reduce churn by 15%,” or “Built reports that cut decision-making time by 25%.”
3. Include Soft Skills
- Problem-solving, communication, and collaboration are critical.
- Data analytics roles often require you to communicate complex findings to non-technical teams, so showcasing your ability to do so can set you apart.
4. Showcase Relevant Projects
- Include projects from previous jobs, academic work, or personal projects.
- Showing that you’ve applied your data skills will boost your credibility.
5. Keep Your Resume Concise and Comprehensive
- Stick to a clean, organized format, and keep it within 1-2 pages.
- By avoiding these mistakes, you can craft a data analytics resume that not only highlights your skills but also demonstrates the value you can bring to potential employers.
- For expert training in data analytics and resume-building workshops.
- Visit www.dataanalyticsmasters.in or call us +91 9948801222.
FAQs
1.What should a data analytics resume include?
A strong data analytics resume should have:
- Contact information
- A professional summary
- Technical skills (SQL, Python, Excel, Tableau, etc.)
- Work experience (with measurable impact)
- Projects and certifications
- Education details
2. How do I write a strong summary for my data analytics resume?
Keep it short (2-3 lines) and highlight your experience, key skills, and career goals. Example:
Data Analyst with 3+ years of experience in SQL, Python, and Tableau. Proven ability to analyze complex datasets and drive business insights to improve decision-making.
3. What are the top skills to mention in a data analytics resume?
SQL & Database Management
Python / R Programming
Data Visualization (Tableau, Power BI)
Excel (Pivot Tables, Macros)
Machine Learning Basics
Data Cleaning & Preprocessing
Business Intelligence & Reporting
4. Should I include a projects section in my data analytics resume?
Yes! Showcase 2-3 projects with clear impact, tools used, and results. Example:
Analyzed 1M+ customer transactions using SQL and Python, identifying trends that increased sales by 15%.
5. How do I list certifications on a data analytics resume?
Mention relevant certifications like:
- Google Data Analytics Certification
- Microsoft Certified Data Analyst Associate
- IBM Data Science Professional Certificate
- Brolly Data Analytics Courses
6. How long should my data analytics resume be?
- Entry-level: 1 page
- Experienced: 1-2 pages
7. Should I include soft skills in my resume?
Yes, but mix them with technical skills. Examples:
- Data storytelling
- Problem-solving
- Business communication
- Critical thinking
8. How do I highlight data visualization skills?
Mention tools like Tableau, Power BI, Matplotlib, and Seaborn, and showcase real projects where you created dashboards or reports.
9. What’s the best format for a data analytics resume?
Use a reverse-chronological format (latest experience first) with clear sections.
10. How do I make my resume ATS-friendly?
- Use standard section headings (Work Experience, Skills, Education, etc.)
- Include keywords from the job description
- Avoid fancy fonts, images, or tables
11.How do I write work experience for a data analyst role?
Use action verbs + tools + impact. Example:
Developed interactive dashboards in Tableau, reducing report generation time by 30%.
12.Can I apply for a data analytics job without work experience?
- SQL, Python, R
- Excel (VLOOKUP, Pivot Tables)
- Tableau, Power BI
- Google Analytics
- Apache Spark, Hadoop (if relevant)
13.Should I customize my resume for each job application?
Yes! Tailor your resume by adding job-specific keywords from the job description.
14. How do I highlight my internship in my resume?
Treat it like a job and focus on tasks, tools used, and impact. Example:
Analyzed 500K+ customer records using SQL, leading to a 12% improvement in customer retention.

 in Hyderabad by Brolly.Group