
How do I Become a Data Analyst

How to Become a Data Analyst: A Simple Guide
- Becoming a data analyst involves improving key skills, gaining practical experience, and continuously learning. Here’s a simple overview:
1.Learn the Basics
- Initially Start with understanding the core concepts of data analysis, such as statistics, business intelligence, and data manipulation.
2.Master Essential Tools
- Gain proficiency in tools like SQL (for querying databases), Excel (for data analysis), and Python/R (for programming and analysis). Learn data visualization tools like Tableau or Power BI to present insights effectively.
3.Take Courses and Certifications
- Enroll in online courses (e.g., Coursera, Udemy, edX) and earn certifications like Google Data Analytics or IBM Data Science to strengthen your resume.
4.Work on Real Projects
- Practice by working on real-world data sets and case studies. Platforms like Kaggle provide datasets that you can use to apply your skills.
5.Build a Portfolio
Create a portfolio showcasing your projects and the skills you’ve developed. This helps potential employers assess your abilities.
6.Get Experience
- Apply for internships or freelancing opportunities to gain hands-on experience in the field.
7.Stay Updated and Keep Learning
- Follow industry trends, attend webinars, and keep learning new tools and technologies to stay competitive.
Topics Covered :
1. Introduction to How do I Become a Data Analyst
What is Data Analytics?
- Data analytics is the process of examining raw data to derive meaningful insights, identify patterns, and make informed decisions or predictions. It involves using various tools, techniques, and technologies to collect, analyze, and interpret data.
Growing Demand for Data Analysts
- Nowadays, In this digital world, businesses generate massive amounts of data daily.
- Companies rely on data analysts to transform raw data into valuable insights.
- Industries such as finance, healthcare, e-commerce, and technology are actively hiring data analysts.
- The demand for data professionals is projected to increase substantially in the upcoming years.
- With automation and AI, data-driven decision-making is becoming a necessity, increasing the need for skilled data analysts.
Who Can Become a Data Analyst?
- Beginners & Students: Anyone with an interest in data, numbers, and problem-solving can start learning.
- Professionals Switching Careers: People from IT, finance, marketing, engineering, and even non-tech backgrounds can transition into data analytics.
- Business Owners & Entrepreneurs: Understanding data can help make better business decisions and optimize strategies.
- Anyone Willing to Learn: No advanced degree is required—learning key skills through courses and hands-on practice is enough to start a career.
Career Benefits and Opportunities
- High Demand & Job Security: Data analysts are in demand across industries, ensuring stable career growth.
- Attractive Salaries: Entry-level analysts earn competitive salaries, and senior positions offer even higher pay.
- Flexible Work Options: Many companies offer remote or hybrid work options, allowing better work-life balance.
- Diverse Career Paths: You can specialize in fields like business analytics, financial analytics, marketing analytics, or even transition into data science.
- Continuous Learning & Growth: The field evolves constantly, providing opportunities to upskill and move into advanced roles like Data Scientist or Data Engineer.
2. What Does a Data Analyst Do?
Key Roles and Responsibilities
- Collecting and Cleaning Data: Gather raw data from various sources and ensure it is accurate and well-structured.
- Analyzing Data Trends: Identify patterns, correlations, and insights using statistical techniques.
- Creating Reports & Dashboards: Present findings using data visualization tools like Tableau, Power BI, or Excel.
- Providing Actionable Insights: Help businesses make data-driven decisions by interpreting analysis results.
- Collaborating with Teams: Work with stakeholders, managers, and IT teams to understand business needs and improve processes.
- Automating Data Processes: Use SQL, Python, or R to streamline repetitive tasks and improve efficiency.
- Ensuring Data Accuracy: Validate data to prevent errors that could lead to misleading conclusions.
Daily Tasks of a Data Analyst
- Extract and clean raw data from databases (SQL, Excel, or cloud storage).
- Analyze trends and patterns using Python, R, or statistical tools.
- Create visual reports using dashboards to present insights to stakeholders.
- Communicate findings in meetings with business teams and decision-makers.
- Monitor and update key performance indicators (KPIs) to track business performance.
- Work on improving data collection methods for better analysis in the future.
- Stay updated on the latest analytics tools and industry trends.
How Data Analysts Help Businesses Make Decisions
- Optimizing Operations: Identify inefficiencies and recommend process improvements.
- Improving Customer Experience: Analyze customer behavior to personalize marketing and services.
- Boosting Revenue: Identify profitable opportunities and minimize risks through data-driven strategies.
- Enhancing Product Development: Use data to understand market needs and improve products/services.
- Supporting Business Growth: Provide insights that help companies scale effectively and make strategic decisions.
- Reducing Costs & Risks: Detects fraud, forecast demand, and optimize resource allocation.
3. Skills Required to Become a Data Analyst
Technical Skills
Excel & SQL (Data Extraction and Manipulation)
- Excel is essential for organizing, cleaning, and analyzing data using formulas, pivot tables, and macros.
- SQL is the backbone of data analysis, allowing you to extract, filter, and manipulate large datasets efficiently.
- Most companies store data in databases, making SQL a must-have skill for querying and handling structured data.
Programming (Python, R)
- Python and R help automate data tasks, perform statistical analysis, and build machine learning models.
- Python’s libraries like Pandas, NumPy, and Matplotlib simplify data manipulation and visualization.
- R is widely used in statistical analysis and research-based data analytics.
Data Visualization (Tableau, Power BI)
- Transform raw data into easy-to-understand charts, graphs, and dashboards for better decision-making.
- Tableau and Power BI help create interactive visual reports that simplify complex insights.
- Good visualization skills help businesses quickly grasp key patterns and trends.
Statistics & Probability
- Helps in understanding data distributions, trends, and relationships between variables.
- Essential for hypothesis testing, predictive modeling, and making data-driven decisions.
- Fundamental concepts like mean, median, standard deviation, and regression analysis play a vital role in data analysis.
Machine Learning Basics (Optional for Advanced Roles)
- While not mandatory for entry-level roles, knowledge of machine learning can boost career growth.
- Helps in predictive analytics, anomaly detection, and automation of data-driven processes.
- Concepts like classification, clustering, and regression are useful for advanced analytics.
Soft Skills
Problem-Solving
- Data analysts tackle business challenges by analyzing patterns and finding data-driven solutions.
- The ability to break down complex problems and approach them logically is crucial.
Critical Thinking
- Helps in questioning data accuracy, identifying trends, and drawing meaningful conclusions.
- Enables analysts to validate insights before presenting them to decision-makers.
Communication Skills
- Data insights must be conveyed clearly to non-technical stakeholders.
- Good storytelling skills help transform raw data into actionable business strategies.
- Writing reports, creating presentations, and explaining technical findings in a simple way is key.
4. Step-by-Step Roadmap to Becoming a Data Analyst
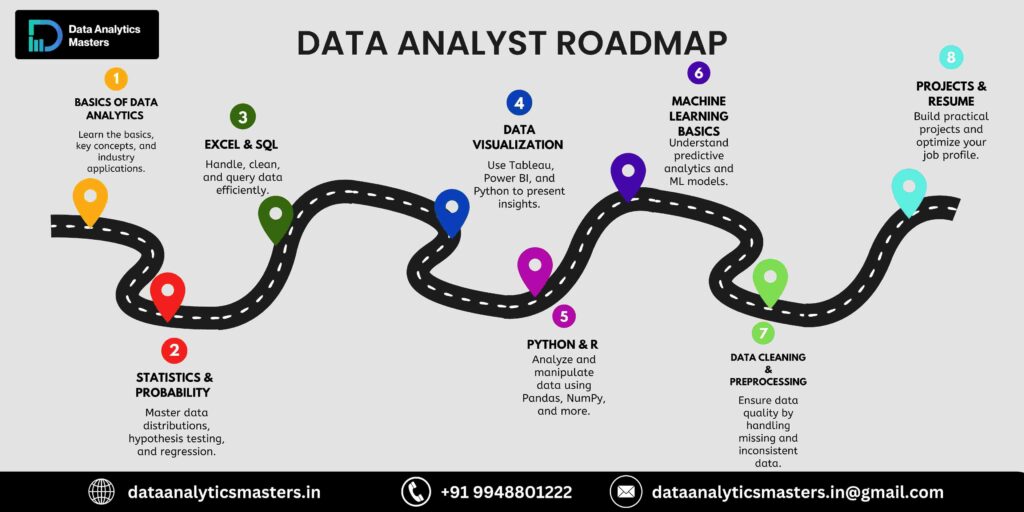
Step 1: Learn the Fundamentals (Math, Statistics, and Business Understanding)
- A strong foundation in math and statistics helps in data interpretation and decision-making.
- Learn key concepts like probability, distributions, mean, median, standard deviation, and regression.
- Understanding business operations and objectives helps in applying data analysis effectively.
Step 2: Master SQL for Data Handling
- SQL is essential for querying, filtering, and managing large datasets stored in databases.
- Learn how to write SQL queries, join tables, and perform data manipulation tasks.
- Most companies use SQL for retrieving and analyzing business data.
Step 3: Learn Programming (Python or R)
- Python and R are widely used for data analysis, automation, and machine learning.
- Python has powerful libraries like Pandas, NumPy, and Matplotlib for data manipulation and visualization.
- R is preferred for statistical computing and research-based analytics.
Step 4: Understand Data Visualization Tools
- Data visualization simplifies complex data and helps stakeholders make informed decisions.
- Learn tools like Tableau, Power BI, and Matplotlib to create interactive dashboards and reports.
- Good visualization skills help in communicating insights effectively.
Step 5: Work on Real-World Projects & Case Studies
- Applying knowledge to real-world datasets improves problem-solving skills.
- Work on projects like sales analysis, customer behavior trends, or financial forecasting.
- Platforms like Kaggle, GitHub, and Google Data Studio offer datasets for practice.
Step 6: Gain Hands-on Experience with Internships or Freelancing
- Internships provide practical exposure to industry tools and workflows.
- Freelancing projects on platforms like Upwork and Fiverr help in building experience.
- Real-world experience strengthens your resume and improves job prospects.
Step 7: Build a Strong Portfolio & Resume
- A well-structured portfolio showcases your skills, projects, and problem-solving abilities.
- Include GitHub repositories, dashboards, and case studies in your portfolio.
- A strong resume highlighting key skills and achievements increases job interview opportunities.
Step 8: Apply for Jobs & Prepare for Interviews
- Look for data analyst roles on job portals like LinkedIn, Indeed, and Glassdoor.
- Prepare for SQL, Python, statistics, and business case study interview questions.
- Practice communication and storytelling skills to explain data insights effectively.
5.how to become a data analyst with no experience
1.Learn the Basics
- Start by learning key skills like Excel, SQL, and basic statistics. These are fundamental for data analysis.
- Use online courses from platforms like Coursera, Udemy, or Google Data Analytics to build a solid foundation.
2.Master Data Analysis Tools
- Learn tools like Excel for data manipulation and SQL for querying databases.
- Start learning programming languages like Python or R for advanced data analysis and visualization.
3.Work on Projects
- Apply your skills by working on real-world projects using publicly available datasets from sites like Kaggle or UCI Machine Learning Repository.
- Showcase your projects on platforms like GitHub or a personal portfolio website.
4.Gain Experience through Internships or Freelancing
- Try to get internships or freelance opportunities to gain hands-on experience.
- Freelance platforms like Upwork or Fiverr can be great for finding entry-level data analysis projects.
5.Get Certified
- Obtain certifications like Google Data Analytics, IBM Data Analyst, or Microsoft Power BI to boost your credibility and enhance your resume.
6.Network and Apply for Entry-Level Jobs
- Connect with professionals in the field through LinkedIn, attend meetups, and join data-related communities.
- Apply for entry-level positions and internships to gain experience and start your career.
6.How to Become a Data Analyst in India
1.Learn the Basics of Data Analysis
- Start by understanding key concepts in statistics, math, and business analytics.
- Familiarize yourself with data analysis tools like Excel and SQL for data manipulation.
2.Master Essential Skills
- SQL: Learn how to query databases and handle structured data.
- Python/R: Learn programming for data analysis, including libraries like Pandas, NumPy, and Matplotlib.
- Data Visualization: Get hands-on with tools like Tableau or Power BI to present data insights effectively.
- Statistics & Probability: Gain a good grasp of statistical techniques to analyze and interpret data.
3.Take Online Courses and Certifications
- Enroll in beginner to advanced courses on platforms like Coursera, Udemy, and edX.
- Get certified in Google Data Analytics, Microsoft Power BI, or IBM Data Science to boost your credibility.
4.Work on Projects
- Practice with real-world data from platforms like Kaggle or GitHub to build your portfolio.
- Focus on projects like customer analysis, sales forecasting, or market research to showcase your skills.
5.Gain Hands-On Experience
- Look for internships or freelance opportunities to work on real-world data problems.
- Build experience by applying your skills to solve business problems.
6.Create a Strong Portfolio and Resume
- Highlight your projects, certifications, and any relevant experience in a portfolio that showcases your data analysis skills.
- Build a resume that emphasizes your technical expertise and practical experience.
7.Start Applying for Jobs
- Look for data analyst roles in companies across industries like IT, finance, e-commerce, and healthcare.
- Prepare for interviews by practicing SQL queries, programming tasks, and explaining your projects.
7. Certifications & Courses to Boost Your Career
Best Online and Offline Courses (Coursera, Udemy, Google Data Analytics, etc.)
- Google Data Analytics Certificate (Coursera) – Beginner-friendly program covering SQL, Python, and data visualization.
- IBM Data Analyst Professional Certificate (Coursera) – Focuses on data handling, visualization, and Python for data analysis.
- Microsoft Excel & Data Analytics Courses (Udemy, LinkedIn Learning) – Covers Excel, Power BI, and SQL for business analytics.
- Harvard Data Science Professional Certificate (edX) – A structured program covering statistics, R programming, and real-world applications.
- Offline Training Programs – Universities and training centers offer specialized courses for hands-on learning and mentorship.
Certifications That Add Value (Microsoft, Google, IBM, etc.)
- Microsoft Certified: Power BI Data Analyst Associate – Recognized for expertise in Power BI and data visualization.
- Google Data Analytics Certification – Industry-relevant certification covering SQL, spreadsheets, and data visualization.
- IBM Data Science Professional Certificate – Offers hands-on training in Python, machine learning, and data analysis.
- AWS Certified Data Analytics – Helps in mastering big data tools and cloud-based analytics.
- Certified Analytics Professional (CAP) – A globally recognized certification validating analytics expertise.
8. Tools Used by Data Analysts
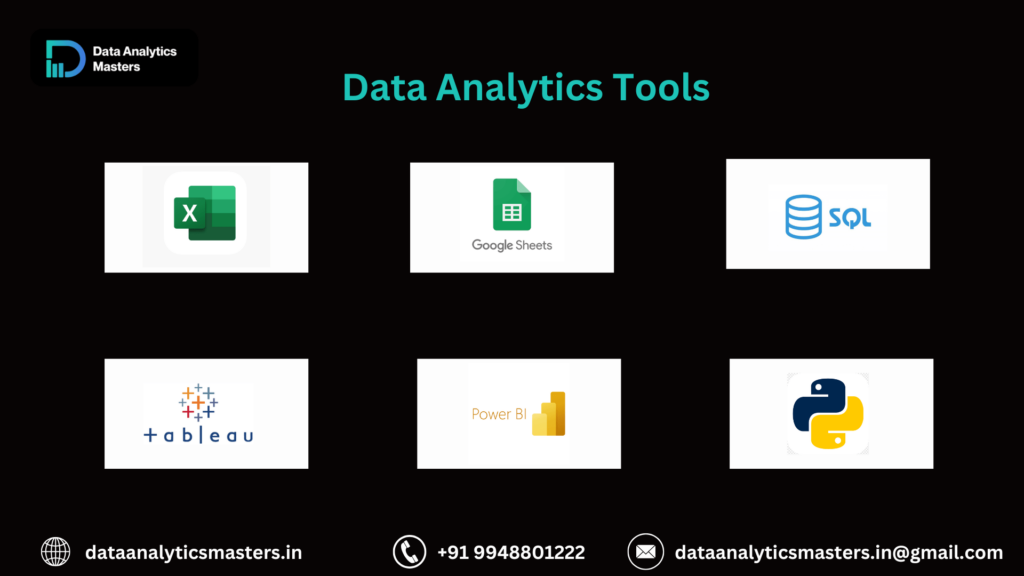
Data Handling & Querying: SQL, Excel
- SQL (Structured Query Language) is essential for extracting, filtering, and managing large datasets stored in databases.
- Excel is widely used for data cleaning, analysis, and visualization with functions like pivot tables, VLOOKUP, and macros.
- Both tools help organize and manipulate data for business insights.
Programming: Python, R
- Python is a powerful programming language with libraries like Pandas, NumPy, and Matplotlib for data analysis and visualization.
- R is preferred for statistical computing, research, and data modeling.
- These programming skills help automate tasks, perform deep analysis, and handle complex datasets.
Visualization: Tableau, Power BI
- Tableau is a user-friendly tool for creating interactive dashboards and real-time visual reports.
- Power BI is a Microsoft tool that integrates well with Excel and helps in data-driven business decision-making.
- Data visualization tools make complex data easier to understand for stakeholders.
Big Data & Cloud: Google BigQuery, AWS, Azure (For Advanced Roles)
- Google BigQuery is a cloud-based tool for handling large-scale datasets and performing real-time analytics.
- AWS (Amazon Web Services) & Azure provide cloud storage, machine learning, and data analytics solutions for big data processing.
- These tools are used by analysts handling large datasets in enterprise environments.
9. Salary & Career Growth of a Data Analyst
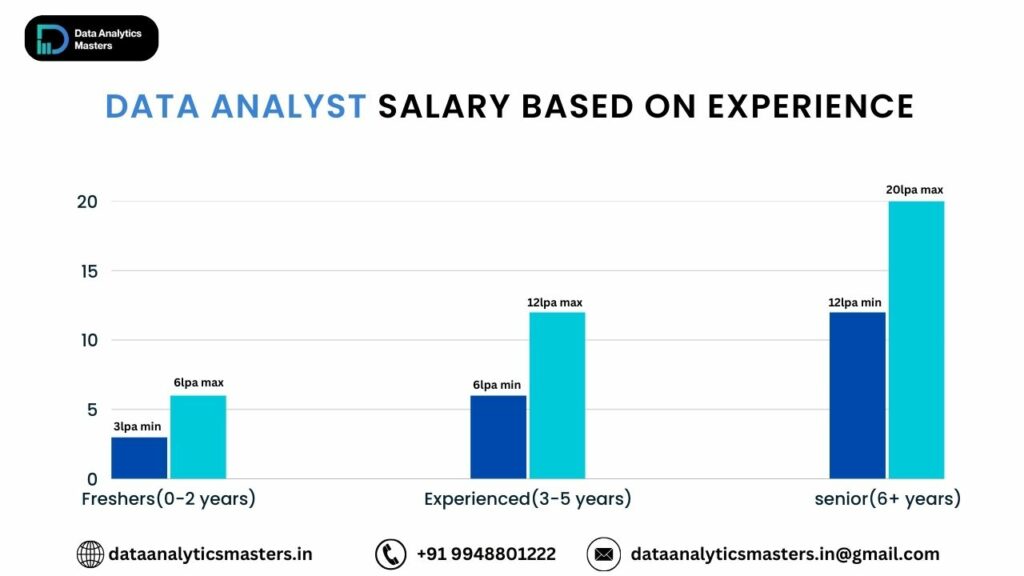
Entry-Level, Mid-Level, and Senior-Level Salaries
- Entry-Level (0-2 years) – Beginners can expect a starting salary ranging from ₹3-6 LPA (India) or $50,000-$70,000 (US) depending on skills and company.
- Mid-Level (3-5 years) – With experience, salaries increase to ₹6-12 LPA (India) or $75,000-$100,000 (US), especially with expertise in SQL, Python, and visualization tools.
- Senior-Level (6+ years) – Senior analysts or team leads earn ₹12-20+ LPA (India) or $100,000-$130,000 (US), often handling complex business problems and mentoring junior analysts.
Salary Based on Industry and Location
- Industry Impact:
- Tech and finance companies offer the highest salaries for data analysts.
- Sectors like healthcare, retail, and e-commerce also have growing demand for data professionals.
- Location Influence:
- Metro cities and tech hubs (Bangalore, Hyderabad, Mumbai, Delhi, New York, San Francisco) offer higher salaries due to increased demand.
- Remote work opportunities allow analysts to work for global companies with competitive pay.
Career Path: Data Analyst → Senior Data Analyst → Data Scientist → Data Engineer
- Data Analyst – Works on data cleaning, visualization, and basic statistical analysis.
- Senior Data Analyst – Leads projects, works on advanced analytics, and collaborates with business teams.
- Data Scientist – Applies machine learning, predictive modeling, and advanced analytics for deeper insights.
- Data Engineer – Focuses on data architecture, pipeline development, and large-scale data processing.
10. Challenges Faced & How to Overcome Them
Common Difficulties Beginners Face
- Data Quality Issues: Beginners may struggle with dealing with incomplete, incorrect, or inconsistent data.
- Solution: Learn data cleaning techniques and use tools like Excel, Python (Pandas), or R to handle and clean data effectively.
- Steep Learning Curve: Mastering tools like SQL, Python, and data visualization software can feel overwhelming.
- Solution: Take small steps, start with beginner-friendly courses, and practice regularly. Simplify complex concepts into smaller, easier-to-understand parts.
- Limited Practical Experience: Beginners may have theoretical knowledge but lack hands-on experience in real-world projects.
- Solution: Work on case studies, participate in hackathons, or take internships and freelance projects to gain real-world experience.
How to Stay Updated with Industry Trends
- Follow Industry Leaders: Stay connected with influencers and experts on LinkedIn, Twitter, or blogs to get the latest updates on trends and best practices.
- Attend Webinars and Conferences: Join online webinars or industry conferences (like PyData, Strata Data Conference) to learn from professionals and network.
- Join Online Communities: Participate in forums like Stack Overflow, Reddit (r/datascience), and GitHub to stay updated on new tools, technologies, and techniques.
- Subscribe to Newsletters: Subscribe to newsletters from platforms like DataCamp, KDnuggets, or Analytics Vidhya for the latest data analytics news and trends.
Tips for Continuous Learning
- Take Online Courses: Platforms like Coursera, edX, and Udemy offer a wide variety of data analytics and data science courses to improve your knowledge.
- Read Books & Research Papers: Books like “Data Science for Business” and “Practical Statistics for Data Scientists” offer deep dives into core concepts.
- Practice with Real Data: Use open datasets from sources like Kaggle, UCI Machine Learning Repository, or government data portals to continuously practice and apply new skills.
- Learn New Tools & Technologies: Keep learning advanced tools like machine learning libraries (Scikit-learn, TensorFlow) and big data tools (Apache Hadoop, Spark) to stay ahead.
11. Future of Data Analytics
Growth of Data-Driven Decision-Making
- Increased Adoption Across Industries: More companies are adopting data-driven strategies to make informed decisions, improving efficiency and outcomes.
- Better Predictions & Personalization: Data analytics helps businesses predict trends and personalize customer experiences, leading to greater customer satisfaction.
- Enhanced Operational Efficiency: Organizations are using data analytics to optimize operations, reduce costs, and improve resource allocation.
- Data as a Competitive Advantage: Companies that effectively leverage data analytics will gain a significant competitive edge in the marketplace.
The Role of AI and Automation in Data Analysis
- AI for Predictive Analytics: AI helps automate the analysis of large datasets, providing insights and forecasts to drive business strategies.
- Automation of Repetitive Tasks: Automation tools are streamlining tasks like data cleaning, report generation, and data extraction, increasing efficiency.
- Machine Learning Integration: Advanced analytics will increasingly incorporate machine learning algorithms for more accurate predictions and automated decision-making.
- AI-Enhanced Data Visualization: AI tools can automatically generate data visualizations and suggest insights, improving decision-making speed and accuracy.
How to Stay Relevant in the Field
- Continuously Learn New Tools: Keep learning and mastering emerging technologies like machine learning, AI, and big data platforms.
- Stay Updated on Industry Trends: Regularly read industry blogs, attend webinars, and network with professionals to stay informed about the latest trends in data analytics.
- Specialize in Advanced Analytics: Specialize in areas like machine learning, big data, or cloud computing to enhance your skill set and stand out in the job market.
- Develop Strong Communication Skills: Being able to clearly communicate complex data insights is crucial. Enhance your storytelling and visualization skills.
- Adapt to Changing Needs: As businesses evolve, data analysts need to adapt to new challenges and industries. Stay flexible and open to new learning opportunities.
Additional Blogs:
Conclusion:
- So, Becoming a data analyst is a step-by-step journey that involves learning, practicing, and applying your skills in real-world situations.
- Start by understanding the basics of data analysis, including tools like Excel, SQL, and Python. Develop your problem-solving skills and learn how to interpret and visualize data effectively.
- Taking hands-on experience through projects and internships will help you gain confidence and showcase your abilities. Earning certifications can also strengthen your profile and make you stand out to employers.
- Continuous learning is key, as the field of data analysis keeps evolving. With dedication and consistent effort, you can build a successful career as a data analyst.
Frequently Asked questions
1.What does a data analyst do?
A data analyst collects, processes, and analyzes data to help businesses make informed decisions. They use Excel, SQL, Python, and visualization software to find trends and insights.
2.What skills do I need to become a data analyst?
- Key skills include:
- Data analysis and visualization (Excel, Tableau, Power BI)
- SQL for database querying
- Programming (Python or R)
- Statistics and critical thinking
3.Do I need a degree to become a data analyst?
A degree in computer science, mathematics, statistics, or business analytics can help, but it’s not mandatory. Many analysts enter the field through self-learning, bootcamps, and certifications.
4.What are the best certifications for data analysts?
- Google Data Analytics Certification
- Microsoft Certified: Data Analyst Associate
- IBM Data Analyst Professional Certificate
- Tableau Desktop Specialist
5.How long does it take to become a data analyst?
If you’re starting from scratch, it may take 6 months to 1 year to develop the necessary skills through courses, practice, and projects.
6.Which tools should I learn first?
Start with Excel, SQL, and Power BI/Tableau for visualization. Then, move to Python for deeper analysis.
7.Can I become a data analyst without coding?
Yes, you can start with Excel, SQL, and visualization tools, but learning Python or R will give you an edge.
8.How do I gain experience as a beginner?
- Work on personal projects using open datasets (Kaggle, Google Dataset Search).
- Contribute to GitHub or open-source projects.
- Take on freelance projects or internships.
Is data analytics a good career?
Yes! It’s a high-demand field with good salary potential and career growth. Every industry needs data analysts to drive decision-making.
10.What are the job opportunities for data analysts?
- Business Analyst
- Financial Analyst
- Marketing Analyst
- Healthcare Data Analyst
- Operations Analyst

 in Hyderabad by Brolly.Group